Considering the market's latest move higher in its ongoing counter-trend rally off March '09 bottom ... one can easily fathom a reasonable view supposing the next six months might not differ all that much from the last six months ... thereby further delaying the prospect of the market's anticipated collapse. This possibility notwithstanding, though, unmistakable signs of growing weakness likely will remain in evidence. For example, momentum, already long fading, probably will deteriorate further still.
Something of the nature of the present moment (in the grand scheme since October 2007 top) appears more surely confirmed as a consequence of the market's latest advance. It seems there remains enough underlying technical strength — even if this largely is being manifest via a general resistance to sell — to levitate major indexes a while longer.
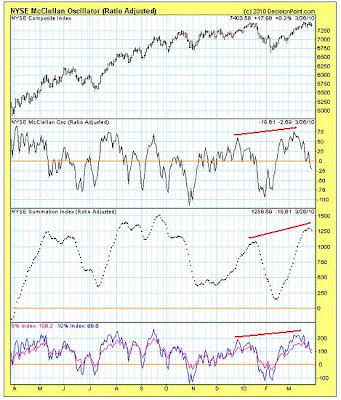
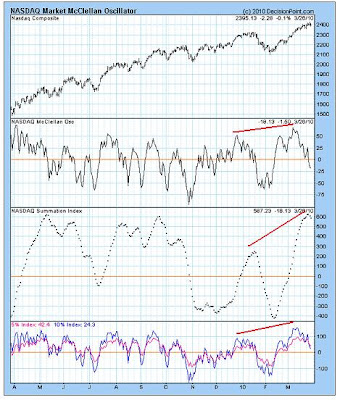
In fact, you might say this probability is increased by improved McClellan Oscillator reads (both NYSE and NASDAQ) accompanying the recent advance...


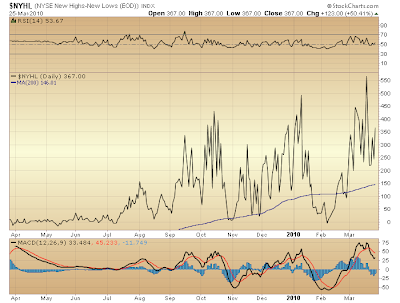
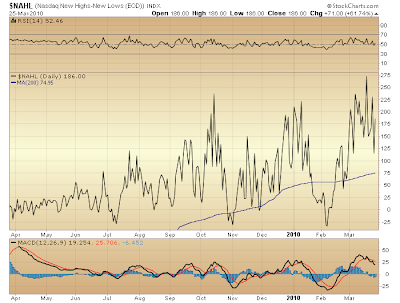
Also bolstering the case for anticipating further levitation over weeks and months ahead is the fact that, the number of listed issues hitting new 52-week highs on both the NYSE and NASDAQ indeed expanded during the advance off early-February bottom (never mind for now the fact that, relative to all issues traded, the expansion in new 52-week highs is fairly pathetic, particularly given how far broad market averages have risen over the past year)...


So, there is a reasonable technical basis for supposing major market indexes might remain relatively buoyant for a time. Yet, that major indexes are trading near the proximity of overhead resistance suggests any additional challenge to my bearish position should be minimal.
Indeed, even if major indexes presently, at last, finally, and once and for all have hit, or shortly will hit, their ultimate top to the counter-trend rally off March '09 bottom, there is a good chance the market still could remain levitated, more or less trading sideways for the next six months or so.
As you know ... from November '08 to present an A-B-C corrective wave (specifically, a 3-3-5 "irregular flat") is seen unfolding. Up to now this corrective wave has been labeled wave (B) of an (A)-(B)-(C) corrective wave down from October 2007 top. That's old news.
Now picture this: what if this 3-3-5 corrective wave [up] from November '08 should mark but wave A of (B) (rather than wave (B) entirely)? Were this true, then wave B of (B) [down] should next unfold over coming months. Being [the now] wave A of (B) took the form of a 3-3-5 "irregular flat," wave B of (B) might likely alternate, and take the form of a 5-3-5 "zig zag."
As such, then, it might not be until the final five waves down finishing this prospective zig zag — that is, specifically, wave (c) of B of (B) — that any serious challenge to March '09 bottom might occur. Prior to this, a general levitation occurring over coming months — more or less resulting in sideways trading — could result in formation of wave (a) — five waves down — as well as wave (b) — three waves up — of this upcoming zig zag forming wave B of (B).
That may be a tough read, but it's worth the visualization. The point is evidence revealing an improved underlying technical condition coinciding with the market's advance off early-February bottom opens the possibility that, with major indexes trading in the midst of overhead resistance, the best that might result is further prolongation of equity's ongoing distribution into weak hands. The above visualization provides some perspective on how this might unfold.
Over the course of upcoming weeks we are likely to see a pullback from current levels once the present move higher off early-February bottom is complete. Remaining to be seen is whether this pullback will mark the first leg lower of a prospective zig zag down (a move slated to eventually challenge March '09 bottom) ... or whether following its conclusion a final move to nominal new high ground (post-March '09 bottom) will yet be in store. In either case a slide back to early-February lows (to the vicinity of respective 200-day moving averages) is thought likely once the present advance off those lows reverses.
Were ultimate top to the counter-trend rally off March '09 bottom to prove some weeks away still, consider this possibility in the context of the view presented recently in "Picture an Extended Period Topping." Bear in mind, too, this prospect still would be in keeping with an outlook toward continued levitation over the next six months or so.
Bottom line, comments here highlight how one might remain extraordinarily bearish (much as I have been, and still remain) without necessarily expecting imminent collapse. Today's analysis simply ventures to frame reasonable probabilities over coming months — how ever relatively subdued these may be — in the context of an ongoing distribution demonstrably continuing to this very moment, portending an eventual day of reckoning when collapse no longer can be postponed.

* * * * *
© The Risk Averse Alert — Advocating a patient, disciplined approach to stock market investing. Overriding objective is limiting financial risk. Minimizing investment capital loss is a priority.
Analysis centers on the stock market's path of least resistance. Long-term, this drives a simple strategy for safely investing a 401(k) for maximum profit. Intermediate-term, investing with stock index tracking-ETFs (both their long and short varieties) is advanced. Short-term, stock index options occasionally offer extraordinary profit opportunities when the stock market is moving along its projected path.
Nothing is set in stone. Nor is the stock market's path of least resistance always known. More often than not, there are no stock index option positions recommended.
 There's an easy way to boost your investment discipline...
Get Real-Time Trade Notification!


