Monday, August 31, 2009

Bear Market Slam Dunk Contest


With solid, technical reason to believe March '09 was not bottom to the bear market that began October 2007, let's talk "slam dunk." That's the forecast trip major stock indexes are slated to take to levels last seen in 1994.

Tonight's wonder is just how fast might the journey be?

Well, first, let's agree that, if March '09 lows are taken out any time over, say, the next nine months, the risk of spectacular collapse is likely to become extraordinarily elevated. Given the speed and technical decimation meted during last year's pasting, one would be out of one's skull to think the greater cause behind it was some irrational, mass overreaction. No! The motive for trimming equity found rationale in the sight of what Ben Bernanke is said these days to have stopped: another Great Depression.

No doubt, serious imbalances still make the climate ripe for gaming the system. Yet, too, there is something to be said for tons of fissile material backing a technically insolvent nation. There's reason for everyone to go along to get along.

However, let's not overlook an incensed citizenry who has had about enough of the Washington, Wall Street marriage. It just might be impossible to further perpetuate any semblance of recent decades' status quo in the measure necessary to keep Congress and the White House obeisant to its capital-starved monster.

Obviously, creditors have no problem with record home foreclosures. Obviously, then, there's every indication no more debt carrots will be forthcoming the masses. So, clearly, the marriage has entered a callous shakedown phase.

Thus, one must wonder, too, whether the very allowance of this massive shakedown of homeowners amidst a highly levered backdrop is poignant admission to the utter unsustainability of the incredibly fragile contemporary arrangement? Could creditors be grabbing what physical things they can before a stop is put to it out of principle brilliantly spoken in the single-sentence Preamble to the U.S. Constitution?

The wild card — the stock market collapse ace-in-the-hole — is in fact the American electorate. Since further sacrifice does not appear part of the national mood, then it looks like there could be a hefty price paid by today's heavy-hitters if the likes have any thought to maintaining their present political power. You think it's a dog eat dog world now? You ain't seen nothing yet.

Now, I could be giving the dull masses too much credit. Maybe there's a lot more Chip Diller — thank you sir may I have another — left in us. If so, then we could be looking at another route to the vicinity of index levels last seen in 1994. This would be a relatively slow grind lower lasting several years. Over the interim technical strength eventually would build in the face of an ongoing, general deterioration in stock prices. The worst of selling likely would come later rather than sooner, making defense of the March '09 bottom a prospect we can look forward to for many months yet.

Indeed, if October 2007 marked the start of an Elliott A-B-C corrective wave down, then wave A (completed in November '08) certainly could be viewed a move that traveled "too far too fast." Thus, once wave B (presently unfolding) is complete, wave C might logically take the form of a declining wedge. This most certainly is a possibility. And it is not the only scenario wherein is maximized the delay in major indexes reaching their ultimate bear market objective.

I've already called the March '09 bottom a Maginot Line because it represents a litmus test of the true value of the "full faith and credit" of the U.S. Treasury. This line holding for many months forward presently is thought critical to lessening the probability of spectacular collapse.

Call it a hunch, but I am not optimistic. I fear the worst.


Fast Money
* * * * *

© The Risk Averse Alert — Advocating a patient, disciplined approach to stock market investing. Overriding objective is limiting financial risk. Minimizing investment capital loss is a priority.

Analysis centers on the stock market's path of least resistance. Long-term, this drives a simple strategy for safely investing a 401(k) for maximum profit. Intermediate-term, investing with stock index tracking-ETFs (both their long and short varieties) is advanced. Short-term, stock index options occasionally offer extraordinary profit opportunities when the stock market is moving along its projected path.

Nothing is set in stone. Nor is the stock market's path of least resistance always known. More often than not, there are no stock index option positions recommended.


There's an easy way to boost your investment discipline...

Get Real-Time Trade Notification!
Friday, August 28, 2009

Dead Financials Offer First Whiff of Weimar Germany Redux


Did you know that, for every $100 in insured deposits the FDIC has 22-cents in its deposit insurance fund?

FDIC List of Problem Banks Surges, Putting Reserve Fund at Risk

Just doing what I can to push things along the path of least resistance ... and speculating that, at virtually the same moment financial markets crater long lines could form outside many a community bank.

Let's step back for a moment and review the big picture presented by the ultimate barometer gauging financial health perceptions by way it measures the movement of money at the frontier of risk: in the stock market.


NYSE weekly

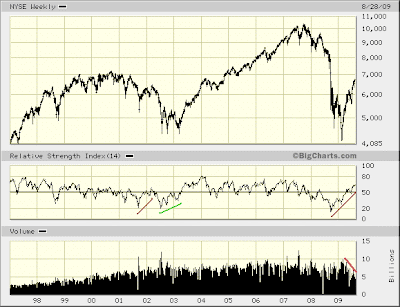
Long-time readers might recall that, near the conclusion of last year's throttling my RSI-based hunch was that a rally similar to late-2001, early-2002 was likely. Indeed, levels to which indexes presently have risen long have been anticipated. True, I thought it possible these levels might be reached much sooner than has happened. Likewise, over the interim reasonable fear crept in and it became prudent to suspect a different path might be taken in reaching this objective.

Well, now that we're quite near the upper end of levels long thought possible, let me add something to an observation I recently made in distinguishing the July 2002 - March 2003 bottoming process from the post-9/11 bounce.

(I believe the market's present rally more closely resembles the latter and will similarly end badly.)

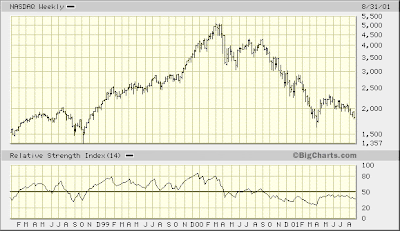
Observe how volume peaked at the culmination of the July 2002 decline, then subsided during October '02 and March '03 retests. Along with improving RSI — notably remaining on the sell-side (i.e. below 50), revealing a healthy dose of underlying fear — volume behavior likewise was typical of a bottoming process (i.e. selling exhaustion was demonstrated).

Contrarily, volume at the March '09 bottom was quite near its peak for the market's entire decline from October '07. Nothing characteristic of a significant bottom has been demonstrated. Thus, in addition to an RSI reversal most conclusively depicting a rather odd measure of fearlessness, volume presents further evidence that, March '09 was no more bottom than was September '01.


NYSE weekly

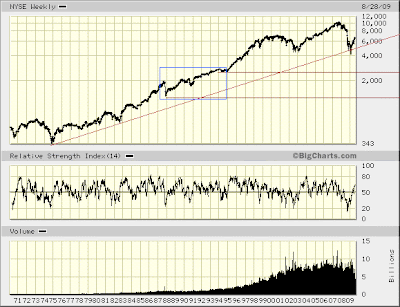
So, levels last seen in 1994 more or less appear a slam dunk. You can quote me on that, Mr. Tenet.

Indeed, a trip back to 1987 is by no means out of the question. And have no doubt. Even worse is quite within the realm of possibility. Such is life when leverage unwinds upon a decimated physical economy.

Yet, here again I draw your attention to volume. Let's consider the "wall of worry." Observe how volume was consistently growing all the way to the October '07 top. So, then, what might we conclude?

How about this... The wall of worry seen over the long-term could grow even bigger. Five years from now we could regularly see 15-20 billion shares exchanged per week, say, as the market reacts to a new order hyper-inflationary explosion resulting from pending collapse of the current order, an event whose likelihood has considerable supporting evidence both technically and fundamentally.

In other words, volume's consistent increase right up to the market's October 2007 top suggests the ultimate top is not yet in. So, following conclusion of this still-unfolding bear market, there's reason to look north of October 2007. Indeed, one might look at what presently is being coined a "dash for trash" — the incredible short squeezes in stocks like AIG, FNM, FRE, C, etc. — as reflecting the wave of the future (no Elliott pun intended). To wit, stocks generally will be driven higher because they can be.

Such could be life in fullness of reality where misguided cowards in influential positions (a.k.a. Monetarist Monkeys) — actors no more talented than bomb sniffing dogs, and no less well-trained and rewarded to boot — effect a whole lot more of their limited specialties. This is the new order hyper-inflationary explosion of which we presently are receiving but a first whiff in the "dash for trash."

This is to say that, looking north of October 2007 does not imply a return of some happy status quo. Rather, think Weimar Germany ... and brace yourself for a putsch. While you're at it dig down deep inside yourself and consider how you might react. Will you be as wise then as you are right now, not being a sucker buying into belief in a "new bull market?"


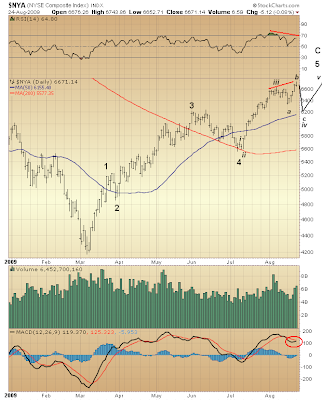
$NYA

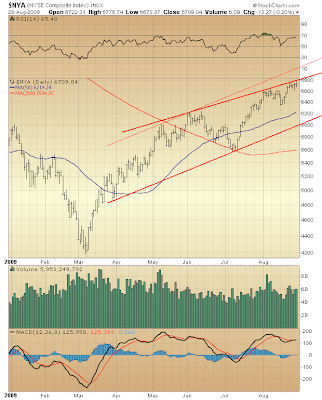
You see the channel guideline last presented here a week ago. Its upper end is the lighter red line. Were five waves up from March '09 presently forming the fifth and final wave (as suggested last Friday), then the upper end of the channel gives an estimation of upside potential.

You also see what instead might be forming: a "rising wedge" over the entirety of wave C since March '09 bottom. At present the lines you see containing this prospective rising wedge are entirely arbitrary. Yet I wanted to throw out this possible scenario. The present climate seems perfectly ripe for drawing in a good many more suckers, don't you think? This could take time. A rising wedge wave C whose 3rd wave presently is forming — with a 4th and 5th wave still to come — would lend such time.

Considered with regard to a high probability stock market collapse pending it stands to reason every effort will be made to maintain optimistic appearances for as long as possible. And on this note it appears no strange coincidence that the situation, technically, appears much as it did during the first half of June.

Duly noted.


Fast Money
* * * * *

© The Risk Averse Alert — Advocating a patient, disciplined approach to stock market investing. Overriding objective is limiting financial risk. Minimizing investment capital loss is a priority.

Analysis centers on the stock market's path of least resistance. Long-term, this drives a simple strategy for safely investing a 401(k) for maximum profit. Intermediate-term, investing with stock index tracking-ETFs (both their long and short varieties) is advanced. Short-term, stock index options occasionally offer extraordinary profit opportunities when the stock market is moving along its projected path.

Nothing is set in stone. Nor is the stock market's path of least resistance always known. More often than not, there are no stock index option positions recommended.


There's an easy way to boost your investment discipline...

Get Real-Time Trade Notification!
Thursday, August 27, 2009

Psych 101


For your consideration.

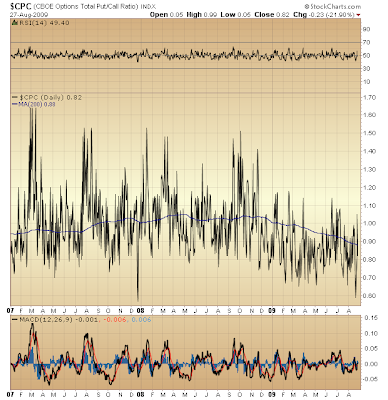
I give you 2009: the year fear was vanquished.


$CPC

Could there be a more fitting "psychological profile" just prior to collapse?


Fast Money
* * * * *

© The Risk Averse Alert — Advocating a patient, disciplined approach to stock market investing. Overriding objective is limiting financial risk. Minimizing investment capital loss is a priority.

Analysis centers on the stock market's path of least resistance. Long-term, this drives a simple strategy for safely investing a 401(k) for maximum profit. Intermediate-term, investing with stock index tracking-ETFs (both their long and short varieties) is advanced. Short-term, stock index options occasionally offer extraordinary profit opportunities when the stock market is moving along its projected path.

Nothing is set in stone. Nor is the stock market's path of least resistance always known. More often than not, there are no stock index option positions recommended.


There's an easy way to boost your investment discipline...

Get Real-Time Trade Notification!
Wednesday, August 26, 2009

Ding Dong


Did you know August 25, 1987 marked the start of five waves down whose third wave was formed by the [20+%] crash of October 19, 1987? I neglected mentioning this yesterday. Not that it's anything other than a curiosity. Yet what was true yesterday, August 25, 2009, remains true today...

Top might be in.


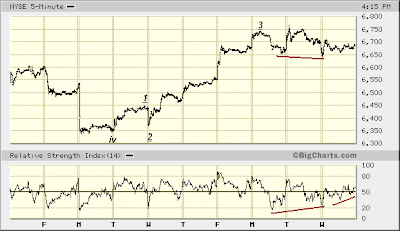
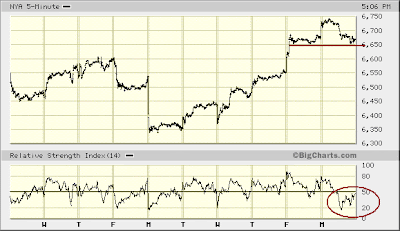
NYSE 5-min

Or maybe not. Wave 4 of v of 5 of C possibly is yet to complete (meaning wave 5 of v of 5 of C is still to come).

It does not matter because top appears very near. The right conditions already have registered announcing a reversal of trend is in store.


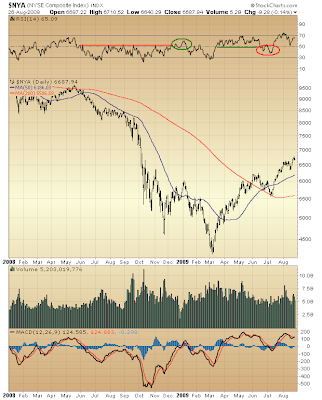
$NYA

Do you see December '08 - January '09 how prior, solidly sell-side RSI (i.e. below 50) reversed to the buy-side of its balance (i.e above 50)? Following this "announcement" of a pending trend reversal, $NYA's bottom was set.

Fast forward June - July '09 and what had been solidly buy-side RSI coinciding with the market's advance off March bottom reversed to the sell-side of the balance.

And there you have it. Who says "they don't ring a bell" when things are about to turn?


Fast Money
* * * * *

© The Risk Averse Alert — Advocating a patient, disciplined approach to stock market investing. Overriding objective is limiting financial risk. Minimizing investment capital loss is a priority.

Analysis centers on the stock market's path of least resistance. Long-term, this drives a simple strategy for safely investing a 401(k) for maximum profit. Intermediate-term, investing with stock index tracking-ETFs (both their long and short varieties) is advanced. Short-term, stock index options occasionally offer extraordinary profit opportunities when the stock market is moving along its projected path.

Nothing is set in stone. Nor is the stock market's path of least resistance always known. More often than not, there are no stock index option positions recommended.


There's an easy way to boost your investment discipline...

Get Real-Time Trade Notification!

Tuesday, August 25, 2009

Back to Nigh


Gaming the system ... is this not natural? And is this not what was presented in technicolor last fall?

So, what potential danger is there in a big city mayor (who happens to be a media empire mogul) doing what Congress instead should be doing? (And on this note, is it likewise potentially problematic that, state Attorneys General have been doing what the SEC supposedly is charged to do?)

No doubt, somehow, Bloomberg is gaming the system. But what's the intention? And what might become "unintended" consequences? (Like those Treasury Secretary Paulson claimed when Lehman Brothers was let go — pure chicken feed, but such is the nature of the system being gamed.)

That weighty, risk-filled, systemic issues remain unresolved to this day is how this present moment is much like last May (2008).

And if I may note, too, a chain is as strong as its weakest link ... and securities crippling the credit system still reach globally.

And if a flea like me could be wondering what might be the risk of a run on the U.S. Treasury, then what might an aristocrat be thinking? Plow money into the riskiest of securities — equities? Think again!

The technical tour is returned to top is nigh. So, this is to say wave iv of 5 of C likely ended last Monday (8.17.09) and wave v of 5 has been unfolding since ... with yesterday's surge at the open marking the end of wave 3 of v.

Indeed, it's possible waves 4 and 5 of v formed today. Thus, top might be in.


Fast Money
* * * * *

© The Risk Averse Alert — Advocating a patient, disciplined approach to stock market investing. Overriding objective is limiting financial risk. Minimizing investment capital loss is a priority.

Analysis centers on the stock market's path of least resistance. Long-term, this drives a simple strategy for safely investing a 401(k) for maximum profit. Intermediate-term, investing with stock index tracking-ETFs (both their long and short varieties) is advanced. Short-term, stock index options occasionally offer extraordinary profit opportunities when the stock market is moving along its projected path.

Nothing is set in stone. Nor is the stock market's path of least resistance always known. More often than not, there are no stock index option positions recommended.


There's an easy way to boost your investment discipline...

Get Real-Time Trade Notification!
Monday, August 24, 2009

Top Might Frustrate, Too


First thing worth noting is OEX options open interest with the August contract now expired. 91k Calls v. 78k Puts. So, we're back to the same starting square. And, in fact, there simply is nothing bullish about this (although equities might still remain levitated for a time).

Some of those calls are hedging short equity positions. Some are sold covered, thus putting a ceiling on the writers' long equity positions.

Some of those puts are hedging long equity positions ... some new, some old. Per the latter, it sure would be nice to know the extent to which this group is selling calls against the long positions it likewise is hedging with puts. These would be strong hands with power to keep prices levitated. Yet this bit of intell I am not privy to.

However the risk of prices remaining levitated is my wonder tonight.

I have been reading Doug Noland's "Credit Bubble Bulletin" for many years now. I can count on one hand the number of times when his outlook from a credit market perspective did not largely match my highest probability expectation toward the stock market. This week's installment (The Depressed U.S. Consumer and Global Reflation) came close to being disagreeable. Stepping back, though, and considering how the stock market's levitation might take form, Noland's more sanguine near-term outlook becomes rather agreeable.

You will recall on Friday a year-to-date, $NYA chart detailing five waves up from March '09 bottom. The 5th wave, unfolding since early July, showed waves i, ii and iii labeled. Wave iv of 5 was not labeled. That's because wave iv might have ended last Monday (8.17.09), or it might still be forming right now. It's impossible to say. Yet this won't forever remain a mystery.


$NYA

In a picture that's the view of an extended levitation: something to seemingly defy the Stock Market Top Appears Nigh thesis, and in so doing find considerable agreement as well.

Presently diverging RSI and MACD at a new 2009 $NYA high support the probability sketched above suggesting a bout of steep selling is in store over days straight ahead. So, too, the modest volume spike Friday and today. Like the previous two volume spikes noted on Friday this one also is occurring at the end of a third wave.

The question is whether it's coinciding with the end of wave c of b of iv of 5 of C? (which is what the above markup suggests) Or did wave 3 of v of 5 of C end today? (in which case top is but hours away)


NYSE 5-min

Alas, there's a new Maginot Line. Break below that and it's straight down to the bottom of this chart she probably goes. Judging by RSI — having severely broken down today ... and then more or less come into buy- and sell-side balance (i.e. in the vicinity of 50) — odds are the Maginot Line does not hold. And if that happens, then top is delayed ... although, still, not very far overhead.

I heard Terranova chirping about "the difficult months" of September and October (watch "Word on the Street" below).

But what if an "ending diagonal [triangle]" — an Elliott Wave construct "that occurs primarily in the fifth wave position at times when the preceding move has gone 'too far too fast' ... " — were to form wave v of 5 of C?

(Hard to find four words that better describe the market's advance since March '09: too far too fast.)

Assuming wave iv of 5 of C is, itself, not yet complete, then supposing a drawn out rising wedge could follow, one sees how the market could hold up through its "difficult months." Just imagine the Monetarist Monkey celebration!

"We made it through October!" ... with more than one observer making some snooty remark about the "sell in May and go away" thesis.

And from that moment on the trip turns south for the winter...


Fast Money
* * * * *

© The Risk Averse Alert — Advocating a patient, disciplined approach to stock market investing. Overriding objective is limiting financial risk. Minimizing investment capital loss is a priority.

Analysis centers on the stock market's path of least resistance. Long-term, this drives a simple strategy for safely investing a 401(k) for maximum profit. Intermediate-term, investing with stock index tracking-ETFs (both their long and short varieties) is advanced. Short-term, stock index options occasionally offer extraordinary profit opportunities when the stock market is moving along its projected path.

Nothing is set in stone. Nor is the stock market's path of least resistance always known. More often than not, there are no stock index option positions recommended.


There's an easy way to boost your investment discipline...

Get Real-Time Trade Notification!
Sunday, August 23, 2009

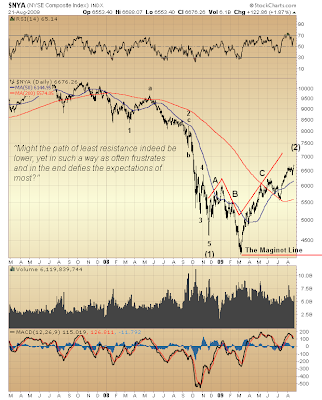
A Look Back, Peering Down the Path to the Maginot Line


I have a sneaking suspicion Friday's post (Stock Market Top Appears Nigh) will be one I refer to many times again over months ahead. Particularly the part where I asked...
Might the path of least resistance indeed be lower, yet in such a way as often frustrates and in the end defies the expectations of most?
How can I not think back to last September? Following the screaming two-day rally of September 18-19, 2008 I was not of the belief the market was on the verge of crashing. Indeed, I was seeing RSI and MACD divergences as indicating that, a bottom was forming ... aware of the fact these divergences were occurring on the decided sell-side of their respective balances ... and so waiting for a pullback whose technical confirmation would justify a long ETF trade.

Well, we got the pullback ... and then some. The minute the low of September 17, 2008 was taken out I knew something was wrong. So, there was no long ETF trade. Yet I was oblivious to the likelihood of what followed.

I was in cash, so I was not crushed. Yet what an opportunity I missed.

I am mentioning this because what might pass in the establishment of the stock market's march lower (down its path of least resistance) likely will see similar unanticipated moments.

In fact, it's entirely easy and reasonable to imagine a Herculean effort likely will be made to hold March '09 bottom. After all, the lender of last resort is all in. And because this is what it took to put a floor under equities, what would this floor's giving out say about Treasury? There, indeed, is fundamental reason, psychologically speaking, to suspect March '09 bottom is a Maginot line whose breaching literally threatens the fall of the American Republic with a crushing blow to its financial backbone.

So, in an effort to reduce frustration I have added a couple things to Friday's $NYA chart making it suitable for printing and hanging as a reminder...


$NYA

* * * * *

© The Risk Averse Alert — Advocating a patient, disciplined approach to stock market investing. Overriding objective is limiting financial risk. Minimizing investment capital loss is a priority.

Analysis centers on the stock market's path of least resistance. Long-term, this drives a simple strategy for safely investing a 401(k) for maximum profit. Intermediate-term, investing with stock index tracking-ETFs (both their long and short varieties) is advanced. Short-term, stock index options occasionally offer extraordinary profit opportunities when the stock market is moving along its projected path.

Nothing is set in stone. Nor is the stock market's path of least resistance always known. More often than not, there are no stock index option positions recommended.


There's an easy way to boost your investment discipline...

Get Real-Time Trade Notification!
Saturday, August 22, 2009

Buff Gratitude


A funny thing happened this morning. When I checked my gmail account there were a half dozen or so requests for Trade Notification. That was unusual. It didn't take long to realize someone had made mention of me.


I truly am flattered! And I agree. Predicting the future based on the past is not a worthwhile objective. Rather, assessing risk based on past technical performance carried to the present, and considering the message therein within the context of reasonable Elliott Wave-based possibilities — likewise tying in current events speaking for the social psychology underlying our contemporary investment world — more or less summarizes how I go about forecasting.

I find that, being "oracular" is less about luck than reasonable discipline. However luck will have some bearing where the rubber meets the road: performance. That's simply because possibilities, though finite, always are several. This is no cop out. It is a statement of fact.

Being that the downfall of most investors probably is due to losing the forest for the trees, I suspect my readers most appreciate the better sense of the big picture they have gotten here thus far. I am certain they all take this game very seriously and appreciate their added ability to augment their own unique sense of opportunity and risk investing in the stock market.

So, performance you see from me is subject to wide swings. Yet not from over-trading. Rather from sticking with positions that are well-justified by the big picture whose possibilities, though finite and several, taken together lend greater assurance that, in the end one's patience will pay.

And Yves, your calling my blog a "guilty pleasure" was the finest thing! That lemming effect in financial markets has its effect on writers, too. Thank you for making me a part of your life and thank you for freely giving me a part of your life, too. Long live the internet...

* * * * *

© The Risk Averse Alert — Advocating a patient, disciplined approach to stock market investing. Overriding objective is limiting financial risk. Minimizing investment capital loss is a priority.

Analysis centers on the stock market's path of least resistance. Long-term, this drives a simple strategy for safely investing a 401(k) for maximum profit. Intermediate-term, investing with stock index tracking-ETFs (both their long and short varieties) is advanced. Short-term, stock index options occasionally offer extraordinary profit opportunities when the stock market is moving along its projected path.

Nothing is set in stone. Nor is the stock market's path of least resistance always known. More often than not, there are no stock index option positions recommended.


There's an easy way to boost your investment discipline...

Get Real-Time Trade Notification!
Friday, August 21, 2009

Stock Market Top Appears Nigh


You know what is rather remarkable? Analysis here does not need to be stretched one wit to justify an extraordinarily bearish posture. That is tonight's first thought. It's how today's trip into new, 2009 high ground becomes "so what."

You probably have heard that, markets typically run both higher and lower than consensus generally expects. We're getting a taste of this. Bottom line, despite growing points of underlying weakness, many technical measures remain disposed on the buy-side of the equation. Hence today's result.

However, the point appears quite near when growing underlying technical weakness will overwhelm greed with fear. Indeed, my general expectation of a turn for the worse expressed over recent months is but being confirmed by all the simple technical evidence I present here from time to time. As always it's important this confirmation continue.

Most generally speaking, there's a solid case for claiming the stock market's path of least resistance points lower. Furthermore, the ultimate collapse I am anticipating still could be months away — possibly even more than a year.

Remember my NASDAQ "like from like" presentation? It was to suggest how past might be prologue, and recently was revisited because prologue is, indeed, mimicking the past.

Well, let's consider a similar view of things where the big money is: the New York Stock Exchange. How might past on the Big Board be telegraphing what's to come?


$NYA

Elliott Wave geeks might take issue with my labeling of five waves down from October '07 through November '08. This might not "look right." However no rules are broken. (If you're thinking these five waves down do not channel, you are correct ... yet channeling is only a guideline, and not a hard-and-fast rule.)

Indeed, think of the right psychology this labeling infers in the grand scheme of a bear market whose bottom is nowhere near.

Wave 2 of (1): a bleed them dry affair, symptomatic of unchecked — unpenalized — greed ... whose ultimate underlying weakness was well-spoken by its taking the form of an Elliott Wave "running correction."

Wave 4 of (1): a we must draw the line, right here and now, reaction — more bravado from greed junkies. Soon thereafter the line was drawn (with help from friends in Washington).

I submit much the same psychology as drove trading into the market's May 19, 2008 peak is seen behind today's trade. Sanguine fundamental thinking once again is being displayed by Monetarist Monkeys who mistake walls of money (in the form of AAA-rated credit) for real economy. Indeed, this mindset is the very life blood of CNBC. Being it's business as usual there, the case claiming greed remains unchecked finds social proof every time Maria squeaks.

Likewise, the similarity with May '08 that underlying technical conditions presently display — seen in relation to conditions during declines preceding each counter-trend rally — substantiates reason to believe a decline far worse than occurred during last year's second half still is in the offing.

So, considering that $NYA's collapse occurred many weeks following its May '08 peak, might its further, far more devastating collapse be many months away (rather than at hand, as some suggest)? Might the path of least resistance indeed be lower, yet in such a way as often frustrates and in the end defies the expectations of most?

Considering the question in light of all prior insights gleaned from the market-leading NASDAQ Composite ... this similar "like-from-like," past is prologue $NYA viewpoint, therefore, extends over virtually the entire U.S. stock market a consistent, "equity is dead money" theme for as far as the eye can see.

Helpful, of course, in defending this position is $NYA's Elliott Wave A-B-C correction off November '08 bottom.

(Hat tip to wave B. Its clear, three-wave form — a 5-3-5 zig-zag [down] — puts the whole of trading from November '08 bottom in perspective, and more critically reveals the market's likely [negative] prospect ... simply by the fact a new bear market low was set during its formation.)

What you see drawn above marking $NYA's behavior off November '08 bottom is meant only to show its general A-B-C, Elliott Wave corrective form. The letters do not appear at the conclusion of each respective wave (unlike the labels marking the sub-waves of wave (1)). I hope that's not confusing.

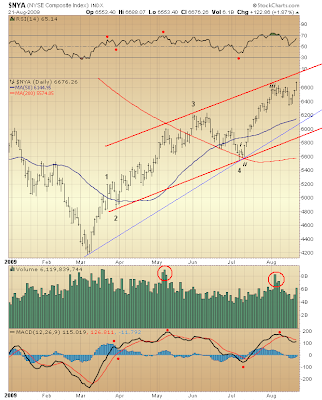
Let's take a closer look at wave C. For as long as it has unfolded I have expected it to subdivide into five component waves. This expectation appears nearly met...


$NYA

You see typical RSI behavior during the formation of five waves up, with wave 4's weaker than wave 2 relative strength indicating an approaching end of the five wave advance off March '09 bottom. That wave 5 RSI is besting wave 3 comes as little surprise, because what's unfolding is a massive wave C — a third wave, typically the most dynamic of all Elliott Waves.

Too, we see momentum behaving quite typically and in a fashion demonstrating growing weakness. Unlike the case with RSI, wave 5's MACD has failed to best wave 3's. Furthermore, this measure presently is fading fast. Surely, the market's advance appears nearly complete.

The circled volume spikes coincide with a third wave's completion: specifically, waves iii of 3 and iii of 5. More wave count confirmation. That the volume spike during wave iii of 5 was less than occurred during wave iii of 3 offers more wave count confirmation still (think third wave dynamics; a third wave of a third wave — wave iii of 3 — likely would be most dynamic).

Per today's volume on a breakout to new 2009 high ground, well, on a scale of 1-10, rating each day's volume since March '09 bottom, today was a 4 at best. Nothing to chirp about. Except where's the fear that makes for increased selling as prices advance (a.k.a. the "wall of worry" the market is said to climb)? What incredible percent are we up from bottom? What ungodly percent did we lose just last year? So, where's fear?

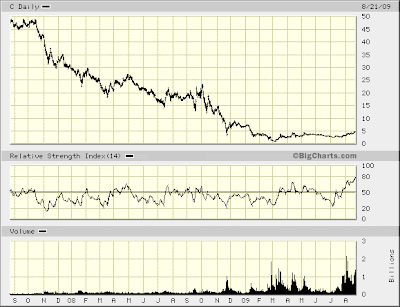
Long holders must be doing their best Citigroup imitation...


company chart (C)

Withholding sales until well after prices collapse. Living the dream only to find the dream isn't real.

Such apparently is mankind's way...


Fast Money
* * * * *

© The Risk Averse Alert — Advocating a patient, disciplined approach to stock market investing. Overriding objective is limiting financial risk. Minimizing investment capital loss is a priority.

Analysis centers on the stock market's path of least resistance. Long-term, this drives a simple strategy for safely investing a 401(k) for maximum profit. Intermediate-term, investing with stock index tracking-ETFs (both their long and short varieties) is advanced. Short-term, stock index options occasionally offer extraordinary profit opportunities when the stock market is moving along its projected path.

Nothing is set in stone. Nor is the stock market's path of least resistance always known. More often than not, there are no stock index option positions recommended.


There's an easy way to boost your investment discipline...

Get Real-Time Trade Notification!
Thursday, August 20, 2009

Such is Life in the Eye of a Financial Hurricane


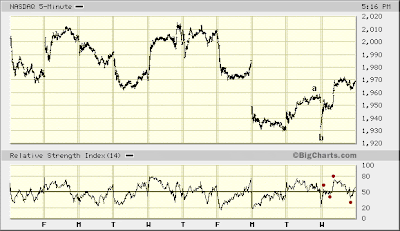
Well, today began as anticipated, but subsequent selling did not materialize. That's a "problem" per any outlook believing top might be in.


NASDAQ 5-min

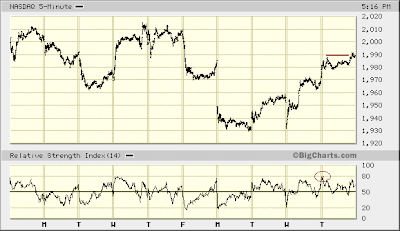
RSI registering a new high during the formation of what was thought yesterday to be wave 5 of c is not a problem. A "c" wave (being a third wave) can be expected to display most dynamic underpinnings during its formation. Thus, 5-minute RSI performance from yesterday's open through today's is not atypical.

The problem with the "top is in" thesis came with the move to new high ground during today's last hour. The five waves of a presumed wave c apparently are not completed. And with top not far overhead, maybe no a-b-c correcting the initial decline from top is forming at all. Maybe instead top is not yet in.


$COMPQ

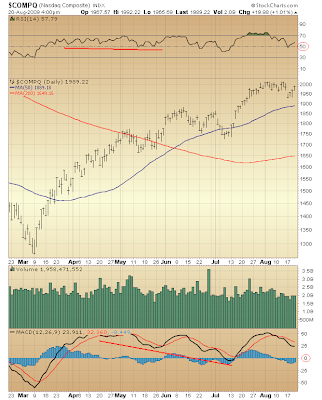
There's something to be said about relative strength (RSI) and momentum (MACD) remaining on the buy-side of their respective ranges. Judging by similar conditions a few months back when both relative strength and momentum were fading — diverging as $COMPQ continued trading higher — one is well-advised at this point not to pound the table about any top being in.

Yet fading these underlying indicators are! Likewise fading is fear (the sell orders that are the "wall of worry's" mortar), as volume testifies. Therefore, rest assured, top is near. And this in the grand scheme of things is all that matters at this moment in history when what lies ahead is a storm for the ages.


Fast Money
* * * * *

© The Risk Averse Alert — Advocating a patient, disciplined approach to stock market investing. Overriding objective is limiting financial risk. Minimizing investment capital loss is a priority.

Analysis centers on the stock market's path of least resistance. Long-term, this drives a simple strategy for safely investing a 401(k) for maximum profit. Intermediate-term, investing with stock index tracking-ETFs (both their long and short varieties) is advanced. Short-term, stock index options occasionally offer extraordinary profit opportunities when the stock market is moving along its projected path.

Nothing is set in stone. Nor is the stock market's path of least resistance always known. More often than not, there are no stock index option positions recommended.


There's an easy way to boost your investment discipline...

Get Real-Time Trade Notification!
Wednesday, August 19, 2009

Another Brief Summer Dose of Keen Market Focus


(Note to self: if the market truly had set a long-term bottom in March '09, there would be little, if any, talk about "correction" at this point following last year's sell-off. Instead, the talk predominantly would be filled with trepidation about a return of the bear market. Never forget that...)

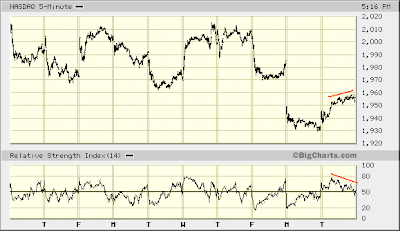
Well, this week so far is proceeding as anticipated. Psychology's momentum (presented Monday via the NASDAQ McClellan Oscillator) is returned to a more balanced state, buyer versus seller. And Monday's wide gap lower in market leader NASDAQ has yet to be filled with this week's school of suckers.


NASDAQ 5-min

Completion of an a-b-c Elliott corrective wave off Monday's bottom awaits but wave 5 of c. You see quite typical RSI behavior during the formation of wave c's first four waves.

Odds are once wave c is completed, it's to the floor we go, finishing the week at a new low (still, probably about the 50-day moving average, though).

Q: Is next week shaping up to be a disaster (the kind that makes for a quick hit stock index options play)?


Fast Money
* * * * *

© The Risk Averse Alert — Advocating a patient, disciplined approach to stock market investing. Overriding objective is limiting financial risk. Minimizing investment capital loss is a priority.

Analysis centers on the stock market's path of least resistance. Long-term, this drives a simple strategy for safely investing a 401(k) for maximum profit. Intermediate-term, investing with stock index tracking-ETFs (both their long and short varieties) is advanced. Short-term, stock index options occasionally offer extraordinary profit opportunities when the stock market is moving along its projected path.

Nothing is set in stone. Nor is the stock market's path of least resistance always known. More often than not, there are no stock index option positions recommended.


There's an easy way to boost your investment discipline...

Get Real-Time Trade Notification!
Tuesday, August 18, 2009

No Bullish Turn in the Market Trend Leader


Keeping with yesterday's NASDAQ trend-leader theme...


NASDAQ 5-min

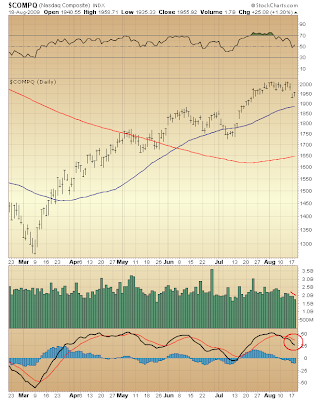
Failing to fill yesterday's [very] wide gap and losing relative strength as today's rally progressed, NASDAQ appears poised for a little more pressure.


$COMPQ

Still no sign of elevated fear precipitating an increase in the number of shares offered up for sale. That's not good if you're a bull, particularly with momentum rapidly fading.

Seems likely, though, NASDAQ's 50-day moving average will offer support ... at least until Friday's August options expiration.


Fast Money
* * * * *

© The Risk Averse Alert — Advocating a patient, disciplined approach to stock market investing. Overriding objective is limiting financial risk. Minimizing investment capital loss is a priority.

Analysis centers on the stock market's path of least resistance. Long-term, this drives a simple strategy for safely investing a 401(k) for maximum profit. Intermediate-term, investing with stock index tracking-ETFs (both their long and short varieties) is advanced. Short-term, stock index options occasionally offer extraordinary profit opportunities when the stock market is moving along its projected path.

Nothing is set in stone. Nor is the stock market's path of least resistance always known. More often than not, there are no stock index option positions recommended.


There's an easy way to boost your investment discipline...

Get Real-Time Trade Notification!
Monday, August 17, 2009

Was the Market Collapse Detonator Ignited Today?


Has the market topped or not? I am, in fact, inclined to think the latter. And yet...


$COMPQ

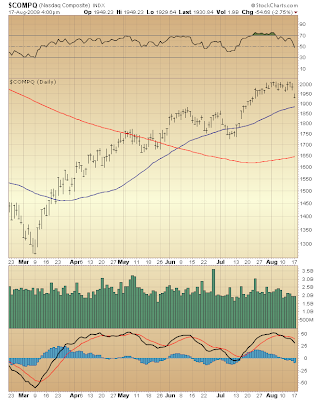
Quite the gap lower today in the trend leader. And look at that volume! No fear? That's interesting. What was that you say, Chip Diller? Thank you, sir, what?

Hmmm. The decided trend lower in momentum (MACD) appears to have a lot of downside room remaining. So, it certainly looks like Chip could get what he's asking for.


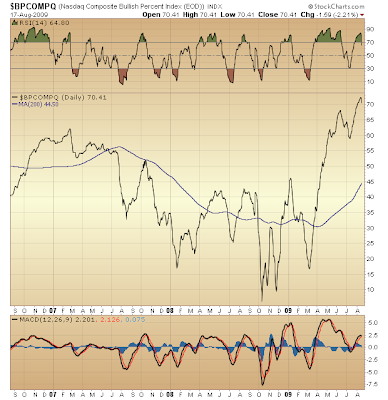
$BPCOMPQ

Q: What do NASDAQ and my garden's tomato plants have in common?

A: Both are burgeoning with fruit ripe for harvest.


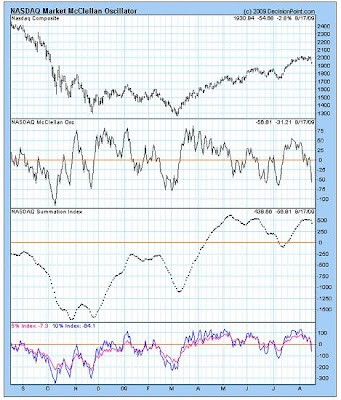
NASDAQ McClellan

Oh, the underlying weakness hinted by McClellan Oscillator and Summation Index divergences!

Yet before the fruit falls from the vine an Oscillator bounce from current, decidedly sell-side momentum to a more balanced position probably is in order here. After all, money manager lemmings have been, in fact, diligently hedging long equity positions with Put options over the past two weeks as the market traded sideways. So, with one week until August expiration the question is whether there are players willing to press their bets, rolling forward position insurance to September?

And if two weeks insured proved fruitless (which today's trade did), then what's another week when a fool and his money has a hankering for chasing dead equity in a dream that sees de-leveraging as being good for stocks?


Revisiting an old post
SEE COMMENTS AND MAKE YOURS


Fast Money
* * * * *

© The Risk Averse Alert — Advocating a patient, disciplined approach to stock market investing. Overriding objective is limiting financial risk. Minimizing investment capital loss is a priority.

Analysis centers on the stock market's path of least resistance. Long-term, this drives a simple strategy for safely investing a 401(k) for maximum profit. Intermediate-term, investing with stock index tracking-ETFs (both their long and short varieties) is advanced. Short-term, stock index options occasionally offer extraordinary profit opportunities when the stock market is moving along its projected path.

Nothing is set in stone. Nor is the stock market's path of least resistance always known. More often than not, there are no stock index option positions recommended.


There's an easy way to boost your investment discipline...

Get Real-Time Trade Notification!
Saturday, August 15, 2009

Timing 401(k) Safety


Back in January 2000 I drafted a report detailing why I believed the first few years of the 21st century would be rough ones in the stock market. This went out to my close associates.

At the time the NASDAQ Composite traded near 4000.


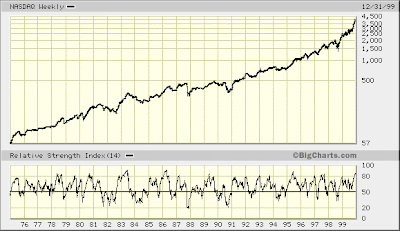
NASDAQ weekly

Appreciate what a bold forecast this seemed to the average Joe and Jane!

Yet following an unprecedented five years straight of 20+% annual gains ... and echoes of 1929 ringing ... with the "new era" in technological progress sounding just like the "new era" of endless industrial prosperity ... and the king of analytical tools — the Elliott Wave Principle — raising cause to believe levels last seen in October 1998 likely would be revisited during the opening years of the 21st century ... my bearish call, in fact, simply was prudently risk averse.

So, let me show you why, when it comes to your 401(k), timing is not everything...


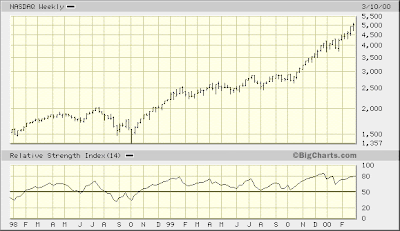
NASDAQ weekly

Two months into Y2k unswervingly bearish me is staring at NASDAQ another 20% higher ... unconcerned for my position (much like right now).

So, in January 2000 I switched my 401(k) out of stocks too early. Having likewise advised others to do the same, you might imagine some were thinking from the greedy side of their brain and lamenting my recommendation that they, too, switch 401(k) investments out of the stock market and into a safe money market alternative their plan offers.

Yet what two words appear beneath "The Risk Averse Alert" in this blog's banner? They're not there for just theoretical or principled reasons! Their wisdom has been demonstrated...


NASDAQ weekly

That's right ... "Patience Pays."

So, because the stock market right now is no place for a long-term investor (which, in fact, your 401(k) makes you), your comfort in the safety of a money market fund deserves supremacy in the face of what substantially has been a giant short squeeze since March '09 bottom. The market's advance since March bottom is not the start of a "new bull market" in stocks. My case for arguing this view has been made over many recent days during recent weeks and months.

Once again, then, I have taken to safety well before the ultimate top in the stock market.

Once again, though, I remain unswervingly bearish and undaunted by any view claiming the status quo of the past thirty years — a period of rising stock prices — has been restored by unprecedented intervention bringing momentary stability in the financial system (as has been claimed by many observers).

Let me put my bearish conviction in "mainstream" terms you might better understand...

If the U.S. economy is 70% consumer-driven, what is the likelihood businesses serving American consumers will experience increasing revenues when taxes are likely to rise? (This would be out of need to offer U.S. Treasury debt buyers physical backing insuring the viability of their investment in Uncle Sam.)

* * * * *

© The Risk Averse Alert — Advocating a patient, disciplined approach to stock market investing. Overriding objective is limiting financial risk. Minimizing investment capital loss is a priority.

Analysis centers on the stock market's path of least resistance. Long-term, this drives a simple strategy for safely investing a 401(k) for maximum profit. Intermediate-term, investing with stock index tracking-ETFs (both their long and short varieties) is advanced. Short-term, stock index options occasionally offer extraordinary profit opportunities when the stock market is moving along its projected path.

Nothing is set in stone. Nor is the stock market's path of least resistance always known. More often than not, there are no stock index option positions recommended.


There's an easy way to boost your investment discipline...

Get Real-Time Trade Notification!
Friday, August 14, 2009

Desperate Times Beckon Desperate Measures


No, that's not me on the left...


Can you believe Mr. Stein? Where's this guy from, Mars? "All my life I have heard about Treasury not being able to issue its debt." Well, welcome to Earth, Rob. The risk is very real.

This extraordinary risk notwithstanding, however, the market could relatively hold up for the rest of the year, much as Mr. Stein suggests. In fact, it seems I indicated much the same just the other day. No doubt my rationale was Elliott Wave-based. Having read in a couple different places fears of an autumn collapse, it seemed prudent to consider the near-term possibility that, the market might remain death-defiant long enough to maximize the number of suckers who become trapped when, virtually overnight, the stock market collapses.

Or, there simply may be no time and no substantive cause for which to maintain the illusion that the "credit crisis" has abated because, in fact, we are suffering a problem far more serious. Truth is we are in the midst of a breakdown of the physical economy and, most ominously, nothing of any substance is being done to address this. Nothing.

Yet financial liabilities and exposures remain intact. Those holding claim to these must be increasingly inclined to act for the sake of minimizing their losses. (I am thinking of JP Morgan Chase's stance toward Lenny Dykstra as a recent demonstration of my point. Not that "Nails" threatens to bring down the financial system. Rather that actions taken against him — with a forced chapter 7 bankruptcy liquidation now being pressed — speak volumes about the urgency of an increasingly desperate situation. Add to this record home foreclosures, the ongoing prosecution of wealthy Americans evading taxes and the push to gut America's health care system, and you see pressure on many fronts exposing how dire is our present financial situation.)

Surely, these conditions make for the kind of breathtaking collapse Mr. Deighan speaks of. The "little guy" might have some difficulty believing the risk of a "lemming effect" among the global financial system's biggest players. Yet this risk is very real. And although no one to my knowledge is speaking of this, you might recall that, back in Y2k it was the rare voice calling the run-up in technology stocks a "bubble." In other words, just because a risk is not widely acknowledged does not mean it is not real.


Fast Money
* * * * *

© The Risk Averse Alert — Advocating a patient, disciplined approach to stock market investing. Overriding objective is limiting financial risk. Minimizing investment capital loss is a priority.

Analysis centers on the stock market's path of least resistance. Long-term, this drives a simple strategy for safely investing a 401(k) for maximum profit. Intermediate-term, investing with stock index tracking-ETFs (both their long and short varieties) is advanced. Short-term, stock index options occasionally offer extraordinary profit opportunities when the stock market is moving along its projected path.

Nothing is set in stone. Nor is the stock market's path of least resistance always known. More often than not, there are no stock index option positions recommended.


There's an easy way to boost your investment discipline...

Get Real-Time Trade Notification!