Friday, December 31, 2010

Fear Among Deer


Looks like there has been enough good sense among long equity interests to hedge their positions over these final days of a month largely spent dressing up portfolios...


$CPC

So, any selling during the opening days of 2011 might be short-lived.

Thus, too, does a rising wedge off late-June bottom find technical support raising the probability that, the market's slight, further advance completing this special Elliott wave form could occur sometime in January...


$OEX

Even were a rising wedge forming off late-June bottom, though, its end might prove more time consuming than the above view suggests. Clearly, capacity to hold deer in the headlights has been running like a well-oiled machine, so levitation's further prolonging seems a reasonable probability.

Another reasonable possibility, too, is that, presently forming is the fourth wave of five waves up from late-June bottom. This fourth wave might form over some weeks ahead ... possibly developing an upward bias, as well. By this view the market's ultimate top could be delayed until, say, March or April.

Yet this outlook finds little technical evidence supporting it. Rather, the preponderance of evidence suggests the end of the market's advance off late-June bottom is near.

Thus, the above Elliott wave possibility finding a rising wedge forming remains a credible prospect, as the current [topping/diverging/weakening] position of those various technical measures regularly presented here conclusively suggest.


Fast Money
* * * * *

© The Risk Averse Alert — Advocating a patient, disciplined approach to stock market investing. Overriding objective is limiting financial risk. Minimizing investment capital loss is a priority.

Analysis centers on the stock market's path of least resistance. Long-term, this drives a simple strategy for safely investing a 401(k) for maximum profit. Intermediate-term, investing with stock index tracking-ETFs (both their long and short varieties) is advanced. Short-term, stock index options occasionally offer extraordinary profit opportunities when the stock market is moving along its projected path.

Nothing is set in stone. Nor is the stock market's path of least resistance always known. More often than not, there are no stock index option positions recommended.


There's an easy way to boost your investment discipline...

Get Real-Time Trade Notification!

Thursday, December 30, 2010

Dark Clouds Ignored Foretell a River of Tears


Folks might ignore or downplay all they will that mountain of debt whose first feature leading to crisis in 2008 remains intact today: the utter physical economic incapacity to generate such new wealth as can sustain present liabilities. Any doubt the trans-Atlantic financial system continues facing a solvency crisis, then, merely is a wishful dream.

Likewise is belief in the power of regulatory authorities to navigate a soft landing. Rather did these agencies fully relinquish their ultimate power to regulate when the Ponzi scheme that is the securitization regime was allowed to become the dictator of policy. All capacity to prevent calamity was lost then, as secure connection between finance and physical economic activity was cast to the wind in a market geared by tax policy favoring asset stripping and leveraging.

So, backed into a corner, those whose misguided views continue holding power over policy accelerate a hyperinflationary trend in place over the past forty years, attempting to maintain the "money-ness" of all financial claims piled up against an ever-collapsing physical economic capacity. Yet this is occurring in a new epoch where confidence in credit markets shall not soon be restored, this the very consequence of power regulatory agencies relinquished in allowing the banking system to become hopelessly entangled in what amounts to nothing more than a Ponzi scheme.

Thus, a global liquidity deluge can only hasten the ultimate demise of all that purportedly is being supported with such policy. While an increasing bulk of credit falls into disarray and gobs of liquidity thrown at the growing problem largely is drawn into areas where confidence has not been crushed, the breakdown of the global physical economy can only accelerate, thus all the more furthering the negative feedback loop that became preordained when regulators were seduced by securitization and the fallacy of risk mitigation this regime claimed to offer.

Truth is those burying from thought this reality appear near to being exposed as little more than duplicitous salesmen. Most troubling (as well as most likely), these represent a mass of wealth that, will not discover until it is too late the error of bliss ignorance toward dynamics presently driving financial and economic collapse. Indeed, this probability finds fitting an outlook where the stock market's sharp and rapid decline could prove the worst ever, as well as not be recovered anytime soon after. Today's well-demonstrated complacency amidst still-growing vulnerabilities worldwide represents an anomaly whose resolution stands to fill a river of tears...


Fast Money
* * * * *

© The Risk Averse Alert — Advocating a patient, disciplined approach to stock market investing. Overriding objective is limiting financial risk. Minimizing investment capital loss is a priority.

Analysis centers on the stock market's path of least resistance. Long-term, this drives a simple strategy for safely investing a 401(k) for maximum profit. Intermediate-term, investing with stock index tracking-ETFs (both their long and short varieties) is advanced. Short-term, stock index options occasionally offer extraordinary profit opportunities when the stock market is moving along its projected path.

Nothing is set in stone. Nor is the stock market's path of least resistance always known. More often than not, there are no stock index option positions recommended.


There's an easy way to boost your investment discipline...

Get Real-Time Trade Notification!

Wednesday, December 29, 2010

Fading Leadership: Not a Pretty Picture


Bob Pisani at CNBC all day today noted the lack of leadership reflected by a contraction of NYSE-listed issues hitting new 52-week highs, this at a time when the NYSE Composite is trading at its high for the year. This being a foreboding technical condition that, I likewise have noted over recent weeks, an update of the situation is in order...


$NYA
$NYHL

Not a pretty picture. Negative divergences galore. This on top of the fact that, such a thin number of listed-issues have reached new 52-week highs over the past year (meaning the majority all the more are being left to suffer under the pressure of their own weight ... a burden that apparently is affecting a growing swath of issues judging by shrinking new 52-week highs since late-June).

With such expanding, positive interest in stocks absent, risk of collapse is all the more elevated, then. Only expanding interest can sustain an advance. Without this the market is at risk. Being a moment when the market's collapse is believed in store, abundant evidence of underlying technical weakness such as is revealed above is best not ignored...


Fast Money
* * * * *

© The Risk Averse Alert — Advocating a patient, disciplined approach to stock market investing. Overriding objective is limiting financial risk. Minimizing investment capital loss is a priority.

Analysis centers on the stock market's path of least resistance. Long-term, this drives a simple strategy for safely investing a 401(k) for maximum profit. Intermediate-term, investing with stock index tracking-ETFs (both their long and short varieties) is advanced. Short-term, stock index options occasionally offer extraordinary profit opportunities when the stock market is moving along its projected path.

Nothing is set in stone. Nor is the stock market's path of least resistance always known. More often than not, there are no stock index option positions recommended.


There's an easy way to boost your investment discipline...

Get Real-Time Trade Notification!

Tuesday, December 28, 2010

More Proof Market Vulnerable to Collapse


Just look what selling restraint is required to keep the NYSE levitated...


$NYAD cumulative

The disparity between the NYSE's skyrocketing cumulative advance-decline line and the real dollars and cents all this apparent excitement for NYSE-listed stocks in fact brings is nothing short of stunning...


$NYA

Stark is the degree of selling restraint that must have been exercised over the past fifteen months amidst a decidedly advancing current whose net impact on the NYSE Composite index has been marginal at best.

If you wonder how days like May 6,2010 can happen, here is your explanation. Clearly, when selling can no longer be restrained the market is vulnerable to collapse.


Fast Money
* * * * *

© The Risk Averse Alert — Advocating a patient, disciplined approach to stock market investing. Overriding objective is limiting financial risk. Minimizing investment capital loss is a priority.

Analysis centers on the stock market's path of least resistance. Long-term, this drives a simple strategy for safely investing a 401(k) for maximum profit. Intermediate-term, investing with stock index tracking-ETFs (both their long and short varieties) is advanced. Short-term, stock index options occasionally offer extraordinary profit opportunities when the stock market is moving along its projected path.

Nothing is set in stone. Nor is the stock market's path of least resistance always known. More often than not, there are no stock index option positions recommended.


There's an easy way to boost your investment discipline...

Get Real-Time Trade Notification!

Monday, December 27, 2010

So, This Is Exhaustion


Continuing with possibility that, a rising wedge forming off late-June bottom is nearing completion...


$NYA

At this point both relative strength (top panel) and momentum (bottom panel) support the likelihood that, several weeks more could elapse before top is reached. Via both these measures — granted, even now diverging from their respective, November peaks — some first-sign of threatening weakness to December's lift probably will register prior to the market advancing to its final peak.

No sign of this weakness yet. It is due, though, and should be more technically damaging than occurred during late-October's consolidation. This, of course, would confirm increasing weakness developing as a presumed rising wedge is thought completing, only further validating prospect that, the first leg of the market's anticipated collapse could soon follow.

More than the market's persistent (yet narrow) levitation over the past couple weeks, the remarkably weakening state of various underlying technical measures suggests the end of the market's levitation over the past fifteen months is near. Thus, what might be a rising wedge forming off late-June bottom prospectively appears all the more credible and ominous...


Fast Money
* * * * *

© The Risk Averse Alert — Advocating a patient, disciplined approach to stock market investing. Overriding objective is limiting financial risk. Minimizing investment capital loss is a priority.

Analysis centers on the stock market's path of least resistance. Long-term, this drives a simple strategy for safely investing a 401(k) for maximum profit. Intermediate-term, investing with stock index tracking-ETFs (both their long and short varieties) is advanced. Short-term, stock index options occasionally offer extraordinary profit opportunities when the stock market is moving along its projected path.

Nothing is set in stone. Nor is the stock market's path of least resistance always known. More often than not, there are no stock index option positions recommended.


There's an easy way to boost your investment discipline...

Get Real-Time Trade Notification!

Thursday, December 23, 2010

A Long-Forming Top Setting Up A Steep Drop


Remaining as true now as in 2008 is the fact that, the Dow Jones Industrials Average could fall to 3600 tomorrow and still remain in a long-term uptrend. Appearing more likely right now, though, is this risk that, the market's long-term uptrend might be soon tested...


DJIA weekly

The Dow's price action since Y2k is seen forming a top — a view supported by persistently deteriorating relative strength over the years that, the great securitization Ponzi scheme has transitioned from an inflating wealth genie to an imploding debt trap. Over this same duration we also see that, as the Dow has fallen to lower lows, these consistently have been confirmed by weaker relative strength. Further price weakness ahead, then, appears signaled by this.

Support for this view that, significant weakness lies in store is gained looking closely at coincident relative strength, first during the market's '08 collapse, and then during its subsequent rally (still ongoing). Let's start with the latter...

Beyond the fact that, presently diverging relative strength (vs. April 2010) reveals underlying technical weakness making the market more vulnerable to contracting, there is the matter of relative strength's disposition during more or less the entirety of the market's advance off March '09 bottom. Observe how the Dow weekly's relative strength largely has been pasted to the positive side of its balance. This is most fitting a corrective wave unfolding amidst a larger decline yet to complete.

Back in the 2002-2003 period one important signal of an impending turn higher in the market came by both relative strength's positively improving divergences upon the Dow's successive retests of its lows at that time as well as relative strength's remaining to the negative side of its balance. This latter condition demonstrated that sufficient measure of fear restraining aggressive buying, such as might later be convinced to take shares off the hands of those supporting the market into March '03 bottom after these subsequently bid the market higher.

Simply in reverse might we consider relative strength's present circumstance. Much as its remaining to the negative side of its balance going into March '03 bottom during what proved a corrective wave within a larger move up was a positive signal, relative strength's present state — glued to the positive side of its balance — is seen a negative (and this most decidedly).

The market's levitation has come amidst a long-lasting imbalance of fearlessness whose greatest technical disparity simply is the fact that, 2008's collapse likely was not a correction-ending, panic-stricken capitulation. Rather, 2008 all too likely was but the beginning of an Elliott corrective wave, and so panic awaits.

Once again supporting evidence is presented via relative strength...


DJIA weekly

The five highlighted instances above mark relative strength coinciding with what are believed Elliott "c" waves. Now contrast October '07 - October '08. The market's decline over that duration was fairly orderly and balanced from a relative strength perspective. Hardly "c" wave-like (with the 1987 collapse particularly providing a useful contrast).

So, relative strength's behavior over these many months since October 2007 top supports my view that, the stock market presently is at risk of a sudden collapse dwarfing 2008. Just how many days more fearless levitation might last remains about the only open question. It could be just a few. The market's technical condition per several measures continues decidedly warning of trouble ahead.


Fast Money
* * * * *

© The Risk Averse Alert — Advocating a patient, disciplined approach to stock market investing. Overriding objective is limiting financial risk. Minimizing investment capital loss is a priority.

Analysis centers on the stock market's path of least resistance. Long-term, this drives a simple strategy for safely investing a 401(k) for maximum profit. Intermediate-term, investing with stock index tracking-ETFs (both their long and short varieties) is advanced. Short-term, stock index options occasionally offer extraordinary profit opportunities when the stock market is moving along its projected path.

Nothing is set in stone. Nor is the stock market's path of least resistance always known. More often than not, there are no stock index option positions recommended.


There's an easy way to boost your investment discipline...

Get Real-Time Trade Notification!

Wednesday, December 22, 2010

A Tired, Tired Levitation


Underlying technical conditions similar to those prior to 2008's autumn blowup presently can be seen via a view of the NYSE Advance-Decline differential contrasting its 10-day moving average with its 200-day...


$NYAD

The lower depths to which the 10-day moving average fell in May 2010 confirming the NYSE Composite's coincident, lower low in relation to February 2010 (as well as late-October 2009) presents the starting point from which the market's subsequent bounce amidst a persistently weakening underlying participation (as evidenced, again, by a fading 10-day moving average simultaneous with a fading 200-day moving average) is seen suggesting that, trouble could be looming.

However one positive presently versus 2008 is the simple fact that, the 200-day moving average of the NYSE daily advance-decline differential is above 0. Back in 2008 the 200-day was negative.

Still, the NYSE Composite presently trades at its high of the past year, while the advance-decline differential's 200-day moving average is nearer the lower end of its range over the same interval. Thus, weakness is seen building and the market vulnerable to a rush for the exits...


Fast Money
* * * * *

© The Risk Averse Alert — Advocating a patient, disciplined approach to stock market investing. Overriding objective is limiting financial risk. Minimizing investment capital loss is a priority.

Analysis centers on the stock market's path of least resistance. Long-term, this drives a simple strategy for safely investing a 401(k) for maximum profit. Intermediate-term, investing with stock index tracking-ETFs (both their long and short varieties) is advanced. Short-term, stock index options occasionally offer extraordinary profit opportunities when the stock market is moving along its projected path.

Nothing is set in stone. Nor is the stock market's path of least resistance always known. More often than not, there are no stock index option positions recommended.


There's an easy way to boost your investment discipline...

Get Real-Time Trade Notification!

Tuesday, December 21, 2010

No Less Certain Than Death and Taxes is Approaching Calamity


Here is an interesting dissection of technical conditions developing as a presumed rising wedge forms off late-June bottom...


$NYA

First, despite atypical relative strength (top panel) and momentum (bottom panel) behavior coinciding with November's formation of this prospective rising wedge's fourth wave (these technical measures typically weaken relative to their respective lows registered during the preceding second wave's formation, which here was during August) we see that, the NYSE Composite Index's momentum in November, indeed, broke its multi-month uptrend, and presently remains stalled below this trend line despite the market's persistent buoyancy over the past couple weeks. This evidence of growing weakness occurring some months into the market's post-flash-crash advance only is furthered by the NYSE Composite's recent momentum divergences, first at November top and once again right now. Thus, technical substantiation of a five wave advance nearing its end is seen accumulating, then.

Now, there is an interesting phenomenon seen developing during formation of the first, third, and now fifth waves of this presumed rising wedge forming off late-June bottom. This specifically is evidenced by price action and coincident momentum during formation of the "b" wave of each of this rising wedge's three impulse waves.

A little background...

What makes a rising wedge "special" in the framework of the Elliott Wave Principle is the fact that its impulse waves (i.e. waves 1, 3, and 5) subdivide into three waves rather than the typical five waves. So, waves 1, 3, and 5 of the rising wedge forming off late-June bottom subdivide into a-b-c waves, rather than fives waves, as is typical.

Observe how during formation of the rising wedge's first wave, its "b" wave (unfolding during the second week of July) saw the NYSE Composite index hit fairly hard, yet momentum held steady. Contrarily, during formation of the third wave's "b" wave (unfolding during the latter half of October) the NYSE Composite more or less traded sideways while its momentum decidedly fell.

Here we are, then, probably in the midst of forming the "b" wave of the rising wedge's fifth wave. Might we see an upwardly biased wave form develop in this instance and unfold in such a narrow range as causes the NYSE Composite index's momentum to fall more precipitously than occurred during formation of wave b of 3 in October? Certainly, this week and next increasingly promise to be as dull as Ben Bernanke, so the prospect appears reasonably good.

Thus might further weakening technical underpinnings usher in 2011 with prospect for a strong start to the new year lasting all of a day or three (completing wave c of 5, and coinciding with all manner of further technical divergences), only to be followed by an awful throttling the likes of which so very few presently fear.

There certainly is no shortage of technical weakness currently belying the market's seeming strength. Supposing this underlying weakness could persist for a couple weeks more and, indeed, deepen is no dilemma at this point. That the endgame appears at hand — resumption of the corrective wave that began in October 2007 — is a probability all the more furthered by the increase in chatter we are hearing in conjunction with major indexes (like the S&P 500) reaching levels last seen when Lehman Brothers declared bankruptcy (9/15/08). With so many technical problems weighing on a market pressing up against an area of resistance whose significance has been long-anticipated here, there is considerable reason to fear some shock obliterating today's well-entrenched complacency among a crowd whose firms likely will not survive the next phase of financial crisis whose chaotic, landscape-altering probability is nearly as certain as death and taxes...


Fast Money
* * * * *

© The Risk Averse Alert — Advocating a patient, disciplined approach to stock market investing. Overriding objective is limiting financial risk. Minimizing investment capital loss is a priority.

Analysis centers on the stock market's path of least resistance. Long-term, this drives a simple strategy for safely investing a 401(k) for maximum profit. Intermediate-term, investing with stock index tracking-ETFs (both their long and short varieties) is advanced. Short-term, stock index options occasionally offer extraordinary profit opportunities when the stock market is moving along its projected path.

Nothing is set in stone. Nor is the stock market's path of least resistance always known. More often than not, there are no stock index option positions recommended.


There's an easy way to boost your investment discipline...

Get Real-Time Trade Notification!

Monday, December 20, 2010

The Post-Flash-Crash, Fugazi Rally


We have more technical evidence supporting the possibility that, five waves up from late-June bottom might be forming a "rising wedge" whose end is fast approaching. This special (and relatively rare) Elliott wave form always develops in the final wave of the prevailing trend and is typically preceded by a move that, traveled "too far too fast."

Certainly, the market's counter-trend rally off March '09 bottom whose initial wave (i.e. wave a) formed into late-October 2009 and saw major indexes advance over 60% qualifies as a move traveling "too far too fast." Thus, the final wave of the market's counter-trend rally off March '09 bottom (i.e. wave c), indeed, could be forming a rising wedge.


$NYA

Technical deterioration coinciding with formation of the fourth wave of the five wave advance off late-June bottom (this relative to the second wave) is evidenced by the behavior of both the NYSE advance-decline differential, as well as the NYSE new high - new low differential...


$NYAD
$NYHL

You have to admit ... the weakening of the NYSE advance-decline differential really belies the market's apparent strength off late-June bottom. This month in particular has been just a pathetic display of upside participation. Like I said last week, for well over the past year there has been nothing like a market dominated by a bunch of complacent suckers whose increasing inclination has been to refrain from such selling as might pressure the market. This most unhealthy undercurrent presently is being plainly revealed, and this as what could be the fifth and final wave forming a rising wedge off late-June bottom proceeds to unfold.

For the time being it appears that, sometime during the opening days of trading in 2011 this prospective rising wedge could complete. According to the Elliott Wave Principle a rising wedge typically is rapidly retraced completely (and then some). Such a prospect presents sight of a frightful first wave down kicking off the market's upcoming decline to levels last seen in the 1987-1994 period.


Fast Money
* * * * *

© The Risk Averse Alert — Advocating a patient, disciplined approach to stock market investing. Overriding objective is limiting financial risk. Minimizing investment capital loss is a priority.

Analysis centers on the stock market's path of least resistance. Long-term, this drives a simple strategy for safely investing a 401(k) for maximum profit. Intermediate-term, investing with stock index tracking-ETFs (both their long and short varieties) is advanced. Short-term, stock index options occasionally offer extraordinary profit opportunities when the stock market is moving along its projected path.

Nothing is set in stone. Nor is the stock market's path of least resistance always known. More often than not, there are no stock index option positions recommended.


There's an easy way to boost your investment discipline...

Get Real-Time Trade Notification!

Friday, December 17, 2010

Unhedged Complacency


The talk of the town today was the unusual decline in the Volatility Index on this options expiration Friday...


$VIX

Well into this afternoon's trading the VIX was down more than 10%. Apparently those who are long equity find no compelling reason to roll their [put option] hedges forward. Thus, put option premiums came in substantially today.

Yet believing that, a calamitous market collapse looms, seeing a contrary consensus otherwise expressing its confidence in the market's prospects is a welcome sign. Dropping flood insurance at a time when any number of severe hurricanes hovering just off the coast could hit land at any moment hardly seems a prudent course of action. Then again, with a bunch of many times over bankrupt investment banks so consumed with maintaining appearances of solvency, there simply might not be enough excess capital available for the likes to afford adequate portfolio insurance.

Whatever the cause of today's unusually sharp pullback in the S&P 500's volatility index, it certainly can be seen fitting circumstance at a point very near the precipice from which the market's spectacular unraveling is thought set to commence.


Fast Money
* * * * *

© The Risk Averse Alert — Advocating a patient, disciplined approach to stock market investing. Overriding objective is limiting financial risk. Minimizing investment capital loss is a priority.

Analysis centers on the stock market's path of least resistance. Long-term, this drives a simple strategy for safely investing a 401(k) for maximum profit. Intermediate-term, investing with stock index tracking-ETFs (both their long and short varieties) is advanced. Short-term, stock index options occasionally offer extraordinary profit opportunities when the stock market is moving along its projected path.

Nothing is set in stone. Nor is the stock market's path of least resistance always known. More often than not, there are no stock index option positions recommended.


There's an easy way to boost your investment discipline...

Get Real-Time Trade Notification!

Thursday, December 16, 2010

The Short Path to Top


The market's continued resiliency amidst extensive technical weakness begs consideration of whether its precipice might arrive early next year...


$OEX

Having 
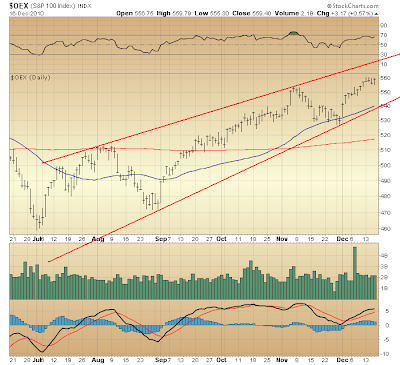
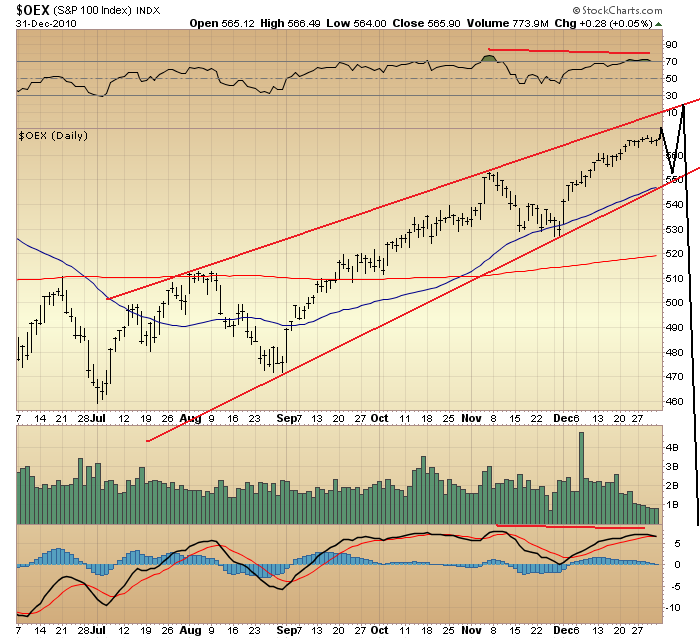
yesterday pegged an OEX objective at 585, it's possible five waves up from late-June bottom are forming a "diagonal triangle," or a so-called "rising wedge," and so we might find the market's top reached sooner than previously thought likely — even as soon as early January 2011.

In light of the likelihood that, a "c" wave might better be thought forming off late-June bottom (rather than a fifth wave), supporting the above "rising wedge" prospect, then, are coincident relative strength (top panel) and momentum (bottom panel). Buoyant RSI and MACD coincident with the market's advance thus far since late-June (as a rising wedge's first four waves, and now its fifth and final wave form) are seen developing in a manner fitting a "c" wave, thus too demonstrating a measure of dynamism typical of an Elliott third wave.

Yet truth is price resiliency persisting as it has (particularly since late-August), as well as [atypical] relative strength and momentum behavior coinciding with five waves up from late-June really are about the only displays of "dynamism" one might cite to qualify this presumed "c" wave completing an a-b-c Elliott corrective wave up from March '09 bottom. All else begs the conclusion that, "something is not right." Glaring underlying technical weakness surely elevates the risk that, the market's correction from October 2007 top could imminently resume with a vengeance.

To now one expressed view toward the prospect the market might levitate for some months more before coming unglued suggested that presently in progress was the forth wave of five waves up from late-June. Thus, a trip back toward 200-day moving averages was thought a reasonable probability in the process of completing this forth wave. Perhaps, though, the forth wave ended on November 30th, and presently unfolding is the fifth wave of a rising wedge forming off late-June bottom.

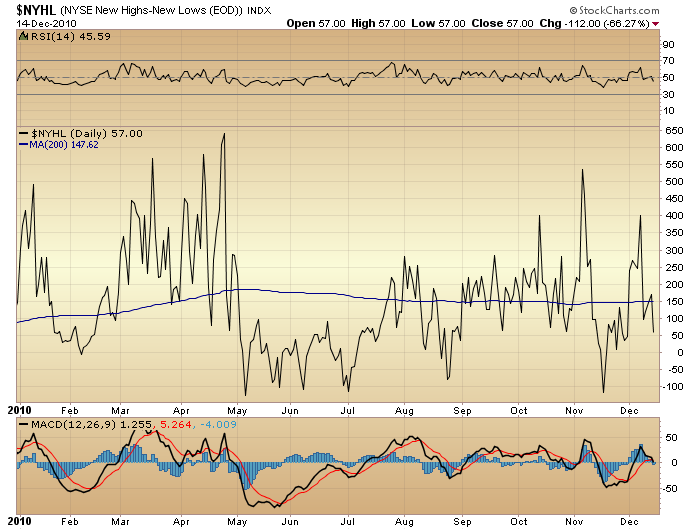
Despite not being evident via RSI and MACD, typical technical deterioration coinciding with formation of the forth wave of a five wave advance (this relative to the preceding second wave) certainly can be seen via the NYSE McClellan Oscillator. Indeed, November's market weakness saw the NYSE McClellan Oscillator dive well below its late-August low, thus lending technical justification supposing that, the forth wave of five waves up from late-June ended on November 30th. It stands to reason technical deterioration typically will increase as a five wave advance nears its completion. The NYSE McClellan Oscillator is demonstrating this.

So, the fifth and final wave of wave c up from late-June presently could be unfolding. Likewise, its end targeting OEX 585 might be reached in a matter of a few weeks. Subsequently (and kicking off wave (C) down from October 2007 top), expect a throttling silencing the masses whose consensus today is claiming 2011 will be positive — with many citing the third year in the presidential term cycle as typically being a bullish one for stocks (the fourth year, too, typically is positive per this same cycle, and this surely was not the way of things in 2008).

Only after this prospective "rising wedge" forming wave c up from late-June bottom is fully retraced (and then some) will 2011 likely have any prospect of being "positive." Indeed, the market's indisputably negative technical state bodes very poorly for prospects in 2011. Whether a "rising wedge" off late-June bottom completes formation over the next few weeks, or a more typical Elliott five wave advance instead sees its fourth wave further develop (thus extending the duration over which wave c forms, but not likely its upside objective), the market's weak technical state (long lasting though it has been) offers clear warning that, a calamitous collapse still remains very much fixed on the horizon.

Vanquished animal spirits amidst an increasingly fearless, hope-filled, optimistic captive interest is not the stuff offering a sure path higher in the stock market. Rather, we have here all the right ingredients for feeding a panic. I don't expect this condition to change as the corrective wave off March '09 bottom completes over weeks ahead, or as the first and second waves of wave (C) down subsequently unfold.


Fast Money
* * * * *

© The Risk Averse Alert — Advocating a patient, disciplined approach to stock market investing. Overriding objective is limiting financial risk. Minimizing investment capital loss is a priority.

Analysis centers on the stock market's path of least resistance. Long-term, this drives a simple strategy for safely investing a 401(k) for maximum profit. Intermediate-term, investing with stock index tracking-ETFs (both their long and short varieties) is advanced. Short-term, stock index options occasionally offer extraordinary profit opportunities when the stock market is moving along its projected path.

Nothing is set in stone. Nor is the stock market's path of least resistance always known. More often than not, there are no stock index option positions recommended.


There's an easy way to boost your investment discipline...

Get Real-Time Trade Notification!

Wednesday, December 15, 2010

Market Still Doomed Per A New Elliott Wave View


It's getting time to consider an alternate Elliott wave view toward the market's trading since October 2007 top...


OEX weekly

The above view extends the Elliott wave count I have been evaluating since March '09 bottom as the final wave of a 3-3-5 "irregular flat" forming since November '08 has been thought unfolding. Labeling and channeling of five waves up from March '09 reflect a valid, "best case" that might be made for the irregular flat's final wave.

From a "right look" perspective, though — considering proportionality of waves (a), (b), and (c) since November '08 — supposing that five waves up from March '09 continue to unfold (forming wave (c) of the "irregular flat") could be a stretch at this point. Had these five waves instead ended in April, then the proportionality of the irregular flat's component waves would not be in doubt. However, given the push into [nominal] new high ground over the past several weeks an alternate view is worth considering here...


OEX weekly

Given the market's profound, underlying technical weakness — an overriding, negative consideration whose gravity cannot be passed off — a "c" wave up from late-June 2010 low traveling only 61.8% the distance covered by wave a up from March - October 2009 seems a reasonable expectation. This targets ballpark OEX 585, just 25 points (4%) higher from here.

Weakness presently revealed via weekly RSI divergences — now versus early-November 2010 and April 2010 before that — support my view that, major indexes are at risk of declining toward 200-day moving averages (very near the 50-week moving average above) and in the process continue formation of a fourth wave of five waves up from late-June 2010.

The market's resiliency in the midst of all manner of underlying technical weakness, (particularly since late-August) is about all we have to cite in rationalizing such "dynamism" as is typical of Elliott third waves (a "c" wave up from late-June being the third wave of an Elliott corrective wave from March '09). Nevertheless, that resiliency, indeed, persists amidst such incredible technical weakness is the sort of circumstance leading one to conclude "something is not right" — the very characterization associated with Elliott "b" waves (according to the Elliott Wave Principle).

Thus, five waves down from October 2007 likely form wave (A), and three waves up from March '09 are forming wave (B). For the moment wave c of (B) (from late-June 2010 bottom) targets OEX 585. A better sense about the time frame in which this objective might be met awaits completion of wave 4 of c.

Again, the market's readily apparent, underlying technical weakness simply cannot be ignored. Big picture, this means the supportive fiber necessary to bolster the market against severe tempests is compromised. Yes, the stock market is behaving resiliently. Yet there is no material confidence backing this. Where art thou voracious bid on an expanding list of leaders? Today's circle jerk among darlings caught in a game of musical chairs is poor imitation. Today's "confidence," then, is better seen a reflection of utter complacency which finds the greater preponderance of interests fearlessly holding long positions. (There has been nothing like increased selling restraint to help goose the market since March '09 bottom!)

Yet there are no shortage of historic storms looming on the horizon. Marking these at the appointed moment awaits wave (C) and a pending trip down to levels last seen in the 1987-1994 period. On this count nothing is changed.


Fast Money
* * * * *

© The Risk Averse Alert — Advocating a patient, disciplined approach to stock market investing. Overriding objective is limiting financial risk. Minimizing investment capital loss is a priority.

Analysis centers on the stock market's path of least resistance. Long-term, this drives a simple strategy for safely investing a 401(k) for maximum profit. Intermediate-term, investing with stock index tracking-ETFs (both their long and short varieties) is advanced. Short-term, stock index options occasionally offer extraordinary profit opportunities when the stock market is moving along its projected path.

Nothing is set in stone. Nor is the stock market's path of least resistance always known. More often than not, there are no stock index option positions recommended.


There's an easy way to boost your investment discipline...

Get Real-Time Trade Notification!

Tuesday, December 14, 2010

The Washington Market


We will see if today's trade completes the market's move up from November 30th, and so too a "c" wave within the corrective wave thought forming since early-November top. As predicted, there has been no increase in willingness to own issues leading the market higher. Indeed, interest here is fading...


$NYHL

Absolutely pathetic (like the nation's political leadership). Thus, the market is poised to rapidly fall and carry major indexes to their respective 200-day moving averages.


Fast Money
* * * * *

© The Risk Averse Alert — Advocating a patient, disciplined approach to stock market investing. Overriding objective is limiting financial risk. Minimizing investment capital loss is a priority.

Analysis centers on the stock market's path of least resistance. Long-term, this drives a simple strategy for safely investing a 401(k) for maximum profit. Intermediate-term, investing with stock index tracking-ETFs (both their long and short varieties) is advanced. Short-term, stock index options occasionally offer extraordinary profit opportunities when the stock market is moving along its projected path.

Nothing is set in stone. Nor is the stock market's path of least resistance always known. More often than not, there are no stock index option positions recommended.


There's an easy way to boost your investment discipline...

Get Real-Time Trade Notification!

Monday, December 13, 2010

Pigcaso Paints a Tape


Here is an unchanged view of five waves up from November 30th bottom...


OEX 5-min

Once again today relative strength sank to challenge its November 30th low (just like last Tuesday). Thus, another fourth wave is thought forming (as was forming last Tuesday). Just one more coat of paint, then, and five waves up from November 30th will be complete.


Fast Money
* * * * *

© The Risk Averse Alert — Advocating a patient, disciplined approach to stock market investing. Overriding objective is limiting financial risk. Minimizing investment capital loss is a priority.

Analysis centers on the stock market's path of least resistance. Long-term, this drives a simple strategy for safely investing a 401(k) for maximum profit. Intermediate-term, investing with stock index tracking-ETFs (both their long and short varieties) is advanced. Short-term, stock index options occasionally offer extraordinary profit opportunities when the stock market is moving along its projected path.

Nothing is set in stone. Nor is the stock market's path of least resistance always known. More often than not, there are no stock index option positions recommended.


There's an easy way to boost your investment discipline...

Get Real-Time Trade Notification!

Sunday, December 12, 2010

Levitation: Take II


For the moment let's regard this month's advance to new high ground since March '09 bottom a further (and more significant) substantiation (following last month's brief lift above April 2010 peak) of prospect that, levitation might continue for some months more.

Indeed, one possibility within the realm of this prospect was developed here a couple weeks ago. A "rising wedge" forming in the fifth wave position might have begun unfolding at the late-June 2010 bottom. This possibility remains valid. Thus, the market's further levitation could leave waves 2-5 ahead (yet with very limited upside to be gained, much as already has been the trend over the past year).

Yet an alternative levitation possibility might have been "telegraphed" during the market's recent five-wave advance off late-August 2010 bottom. This possibility assumes quite fairly that, early-November top marked the end of that five-wave advance — an advance whose fourth wave formed an upwardly biased triangle extending for a longer duration than previously had been considered. Something similar to this fourth wave might yet develop over months ahead, and so, sustain the market's levitation...


$OEX

Like the "rising wedge" possibility, this one also places the end of wave (4) (of five waves up from March '09 bottom) at late-June 2010 bottom. Since then, the first three waves of wave (5) appear to have unfolded, with wave 3 of (5) ending early-November 2010. Upwardly biased wave iv of 3 (forming from mid-September to early-November) might offer insight into what lies in store over months ahead.

One objection toward the market's advance off late-August bottom has been made recently in relation to the performance of the NYSE McClellan Oscillator. Yet if you look closely, you will see that, wave 3 of iii of 3 of (5) (unfolding on September 13, 2010) coincided with the NYSE McClellan Oscillator's peak since late-August bottom. So, the above wave count gains considerable substantiation as a result.

Channeling of waves i-v of 3 likewise helps substantiate the above, alternative Elliott wave view. The market's behavior in relation to this channel since wave 3 ended suggests a hard turn lower might be at hand, too. Increasing underlying weakness revealed by the NYSE McClellan Oscillator bolsters this possibility, as do NYSE Bullish Percent Index divergences noted Friday.

Yet formation of an a-b-c corrective wave from early-November top might complete but wave a of 4 of (5). Waves b and c (and, indeed, d and e) of 4 of (5) could yet develop before a final lift forming wave 5 of (5) unfolds, and completes the market's five-wave advance off March '09 bottom.

True as it is that, way back in late-2008 I strongly suspected the market could react back to levels at which it presently trades (this following 2008's disaster), I never really accounted for such a prolonged duration being spent keeping the coyote in suspended animation, this after having traveled over cliff's edge. Yet here we are looking at the prospect the market might be made to levitate still more.

Again, this is just a possibility. Nevertheless, much as underlying, technical weakness only has grown over the past year while the market has levitated, the same should continue were the market to levitate more. There's certainly nothing suggesting the market's weakened technical condition is on the verge of reversing, so a meager levitation breeding confusion sets up to be about the best the lot of over-leveraged fakers (all the way up to the U.S. Treasury) will be able to manufacture.

* * * * *

© The Risk Averse Alert — Advocating a patient, disciplined approach to stock market investing. Overriding objective is limiting financial risk. Minimizing investment capital loss is a priority.

Analysis centers on the stock market's path of least resistance. Long-term, this drives a simple strategy for safely investing a 401(k) for maximum profit. Intermediate-term, investing with stock index tracking-ETFs (both their long and short varieties) is advanced. Short-term, stock index options occasionally offer extraordinary profit opportunities when the stock market is moving along its projected path.

Nothing is set in stone. Nor is the stock market's path of least resistance always known. More often than not, there are no stock index option positions recommended.


There's an easy way to boost your investment discipline...

Get Real-Time Trade Notification!