I am as comfortable with my position right now as I was yesterday, last week, last month, and several months before that, too. There is every reason to believe — all technically well-grounded — market risk over the past six months (largely spent trading sideways) has been, and still is, elevated to say the least.
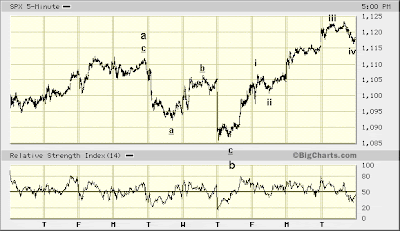
The rally off last week's low — its strength largely unforeseen — but alters wave 2 of five waves down. This anticipated, 5-wave decline — whose first wave (down) commenced at mid-January 2010 peak — is expected to challenge March '09 bottom over months ahead.

From the very get-go the Elliott wave view of the rally off last Thursday's bottom (2/25/2010) was thought that of a "c" wave. It remains so. Yet now it is seen being at the same "level" as those [advancing] waves off early-February bottom (i.e. following completion of wave 1 down).
This is to say a larger a-b-c off early-February bottom is near completing. This could even mean wave 2 of five waves down from mid-January 2010 top is just about done ... and the shock of wave 3 might come before March is over.
A 3-3-5, a-b-c Elliott corrective wave off early-February bottom formed up to Monday, February 22, 2010. This a-b-c corrective wave has for some time been supposed but wave a of 2, with waves b and c of 2 still to follow.
Well...
Have waves b and c followed? You've gotta like the like-from-like. Wave a of 2: a 3-3-5 upwardly biased irregular flat ... and wave 2, itself: a larger, upwardly biased 3-3-5 irregular flat.
You've also gotta like the alternation...
Wave a of 2: a 3-3-5 "flat" ... wave b of 2: a 5-3-5 "zig-zag."
Per wave c of 2 presently unfolding ... there probably is more to go. Of the five waves forming wave c of 2, the third ended today and the fourth may have ended, too. Looking ahead, wave c of 2 likely will be done before the week is over. In fact, I wouldn't be surprised if its peak is reached by noon on Wednesday.
The larger, a-b-c corrective wave off early-February bottom could, in fact, again, form but wave a of 2 (rather than wave 2 in its entirety; this same thinking was put forward a little over a week ago, at the peak of wave a on Monday, 2/22/2010). Yet, considering the NASDAQ happy dance we are seeing (if only in relative price and volume outperformance versus NYSE), there is a matter of "trend" well-established over the course of the formation of the large, Elliott corrective wave unfolding since October 2007, that bears notice here, because it raises suspicion wave 2 (rather than just wave a of 2), indeed, might be approaching its end.
To wit: just prior to sizable dives, NASDAQ typically shines.
We saw this at the very peak in '07. We saw it again during the July-August 2008 counter-trend rally. We are seeing this once again right now.
Of course, there are subtle differences, now versus prior instances. These, however, simply are a matter of differences in Elliott waves unfolding at each respective moment. Still, in all cases something solidly representative of this now well-established, foreboding trend is present.
There's no mistaking NASDAQ's sudden show of strength following its most recent, protracted period of accumulated underlying technical weakness: since 2007 this is proven to be like a drowning man coming up for what might be a final gasp of air. Thus, wave 2 of five waves down from January 2010 top might be moments from completing ... and wave 3 about to sweep upon the scene.
One also might be wise to ponder in the framework of this same, proven, foreboding trend NASDAQ's relatively better show of strength, price-wise, versus NYSE off March '09 bottom. Consider this in the context of NASDAQ's much worse prior performance since, say, Y2k top: what to make of NASDAQ's renewed strength? Might this not but another, rather larger manifestation of misplaced optimism? "This must be the bottom," goes the thinking, so money quickly moves into the most badly beaten issues.
Since the second half of 2007 we have seen a couple smaller instances when a sudden burst of optimism revealed in NASDAQ trading ultimately resulted in disappointment. It is my contention the larger manifestation of misplaced optimism whose mistake is yet revealed, will eventually lead not just to disappointment, but rather complete disillusionment.
That's something we haven't seen since the late-'70s, early-'80s. NASDAQ 300 will do the trick. That's a long way down from here. I remain as convinced now as I ever have been that, risk of such disillusionment is extraordinarily high.

* * * * *
© The Risk Averse Alert — Advocating a patient, disciplined approach to stock market investing. Overriding objective is limiting financial risk. Minimizing investment capital loss is a priority.
Analysis centers on the stock market's path of least resistance. Long-term, this drives a simple strategy for safely investing a 401(k) for maximum profit. Intermediate-term, investing with stock index tracking-ETFs (both their long and short varieties) is advanced. Short-term, stock index options occasionally offer extraordinary profit opportunities when the stock market is moving along its projected path.
Nothing is set in stone. Nor is the stock market's path of least resistance always known. More often than not, there are no stock index option positions recommended.
 There's an easy way to boost your investment discipline...
Get Real-Time Trade Notification!


