Tuesday, August 31, 2010

Blowing Up the Bubble of Pessimism


It sure looks like selling interest driving the market lower increasingly is forcing the long side to step up...


$OEX

That's one way to read volume these past couple months.

Today appeared much the same bear game...


OEX 1-min

... and looks to be forcing the long side to step up once again.

So far, many divergences hold. Check out Advances-Declines and McClellan Oscillators. Yet so much technically remains decidedly negative, too. Any letup in support — or increased selling urgency — could turn devastating in a heartbeat.

Straight ahead, challenges — power plays — against whatever interests are supporting March 2009 lows seem likely to increase. Why not. The Fed is in disarray and its needed liquidity cannot last forever.

Terranova tells us we're in a "bubble of pessimism." Bzzzz. Wrong.

Over at Barry Ritholz's Big Picture blog you should read his post of a day ago on the market's decidedly negative sentiment. This is fine accompaniment to my thoughts Friday on AAII bullish sentiment presently rivaling lows recorded at March '09 bottom.

Ask yourself this...

When "fewer than 29 percent of ratings for stocks covered by brokerages worldwide are 'buys,'" from where will support come should conditions suddenly become vulnerable to panic?

Oh, that's right ... there's nothing to worry about. The "bubble of pessimism" is about to burst because convincing a jobless man the lost decade is over is subject to the same magic bringing belief ... and, more importantly, money ... as climate change.


Fast Money
* * * * *

© The Risk Averse Alert — Advocating a patient, disciplined approach to stock market investing. Overriding objective is limiting financial risk. Minimizing investment capital loss is a priority.

Analysis centers on the stock market's path of least resistance. Long-term, this drives a simple strategy for safely investing a 401(k) for maximum profit. Intermediate-term, investing with stock index tracking-ETFs (both their long and short varieties) is advanced. Short-term, stock index options occasionally offer extraordinary profit opportunities when the stock market is moving along its projected path.

Nothing is set in stone. Nor is the stock market's path of least resistance always known. More often than not, there are no stock index option positions recommended.


There's an easy way to boost your investment discipline...

Get Real-Time Trade Notification!

Monday, August 30, 2010

Mr. Market Calls In Sick


Pathetically weak seems an apt phrase describing the market's condition here. There simply is no bid to be found.

Two weeks ago in "Confirming the Hindenburg Omen" I noted similarity to the May-June 2008 period. This similarity apparently continues with the market's inability to attract a sustained bid. So, forget about still rising momentum more recently highlighted here, and consequent possibility of a decent bounce. This same condition existed back in May-June 2008, and we know where that led.


OEX 5-min

Despite there being no sustained bid some measure of support does appear to be developing, as the relative strength of selling occurring in the range of trading over the past five days is flattening out, suggesting the intensity of selling is diminishing. So, the projected, near-term completion of five waves down from August 9th finds some technical basis supporting this likelihood.

Now, it is also possible that, these five waves down ended last Wednesday (were wave iv seen ending last Monday, shortly after the open). So, correction of the market's move lower since August 9th might be underway here. This, too, might explain relative strength's greater balance between the buy- and sell-side over the past five days.

Given the possibility five waves down from August 9th already are completed, there still is the matter of last Tuesday's gap lower and coincident RSI collapse to its lowest extreme yet. This is seen indicating more selling yet to come. Whether immediately (as five waves down are completed), or following a bounce (as five waves down are corrected) presently is unclear.


Fast Money
* * * * *

© The Risk Averse Alert — Advocating a patient, disciplined approach to stock market investing. Overriding objective is limiting financial risk. Minimizing investment capital loss is a priority.

Analysis centers on the stock market's path of least resistance. Long-term, this drives a simple strategy for safely investing a 401(k) for maximum profit. Intermediate-term, investing with stock index tracking-ETFs (both their long and short varieties) is advanced. Short-term, stock index options occasionally offer extraordinary profit opportunities when the stock market is moving along its projected path.

Nothing is set in stone. Nor is the stock market's path of least resistance always known. More often than not, there are no stock index option positions recommended.


There's an easy way to boost your investment discipline...

Get Real-Time Trade Notification!

Friday, August 27, 2010

Bernanke Must Go, Or We Are Screwed


I am not convinced today initiated the bounce I have been anticipating. There was curious weakness displayed...


OEX 5-min

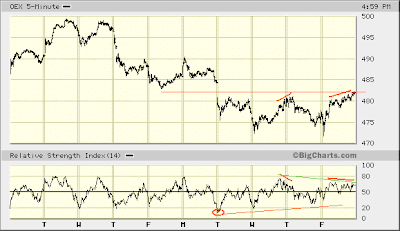
We see a similar RSI divergence today as yesterday when the OEX peaked. Then, too, yet another divergence as today's peak RSI fell short of Wednesday's, this as the OEX rose a bit higher. This is making Tuesday's gap lower appear significant.

(On this note look how Monday's initial advance carried the OEX right up to its gap lower on Thursday prior, preceding the market's turning down hard yet again.)

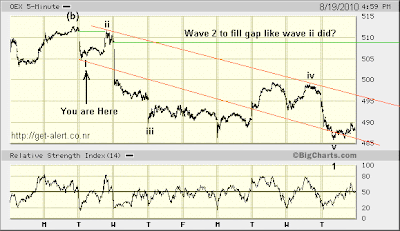
So, there's reason to believe the decline since August 9th is not over. The fifth wave of five waves down likely could be still forming.


$OEX

There is the five-wave channel from August 9th. The fifth wave is seen unfolding since August 18th.

Volume confirms this wave count, with its peak having come during formation of the third wave on August 11th, and its second best occurring a few days ago — Tuesday, 8/24/2010 — when the third wave of wave five down unfolded.

On the 5-minute chart above take notice of relative strength since Tuesday's sell-side extreme. You see how RSI appears to be improving — indeed, diverging as the OEX moved lower Wednesday and today. We saw this much the same earlier, as the 3rd wave down from August 9th was completing...


OEX 5-min

This was only followed by a further decline on Monday, August 16th, at the start of trading. Curiously enough, too, relative strength that Monday revealed increasing weakness, signaling more selling yet to come ... the likes of which we have seen, in fact, right up to today's turnaround. Thus, this past Tuesday's relative strength weakness — the greatest yet since August 9th peak — is seen suggesting more selling still to come ... the likes of which could complete the fifth wave of five waves down.

The market's decline since August 9th could challenge early-July bottom. Who knows, maybe RSI on the 5-minute chart will reach an even deeper sell-side extreme, signaling further weakness still ahead, and this in a rather revealing manner (at least to those paying attention).

So, following the projected completion of the fifth wave down upcoming, the spirit of 
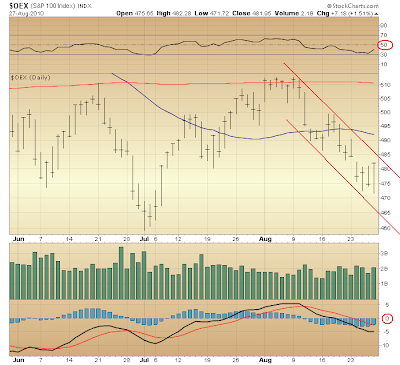
Tuesday's July '09 Redux remains in play. In that piece I neglected to note something both important and plainly evident. The relative positions of both the 50-day and 200-day moving averages are precisely reversed, now versus July '09. This condition further supports an outlook supposing any bounce upcoming likely will be notably weaker. Today's more negatively poised moving averages are icing on the cake, whereas persistently weakening momentum over the course of the market's counter-trend rally off March '09 bottom are what the cake is made of. Seen in this context, these moving averages likely will prove formidable resistance at the very least.

This upcoming bounce has been anticipated for more days than it deserves, really. I say this notwithstanding the most recent American Association of Individual Investors survey finding just 21% of those polled bullish. This low measure is rivaled only by the 19% at March '09 bottom.

If anything, the market's upcoming bounce might prove more durable than meager. In other words, any move higher might take some time and still get relatively nowhere. Recent trends reveal a prolonged, narrow, directionless trade unfolding near tops, so this is a possible facet worth anticipating, as well.

You might recall that, back in July '08 bullish sentiment also tanked. This recovered some during the market's uneven bounce in August '08, while remaining decidedly below peak levels set prior to October 2007 (thus suggesting the market might rise further still). Yet nothing about reduced bullish consensus proved consequential, however, once it came time for the massive capital raise from September-October, 2008.

These sentiment readings have to be seen in the context of what has preceded. Following 2008's massive collapse and 2009's equally monstrous comeback, skepticism such as we are seeing here could prove counter-productive to weak-handed institutions (still much too leveraged) currently driving trading.

We know strong hands have been distributing equity ever more increasingly over the past thirteen years. So, forget about any substantive bid soon materializing on that front. Has this not already been thoroughly demonstrated over the course of the past year? That individuals want no part stands as but another bid source absent. This leaves institutions — some of which are well-capitalized — possibly more disposed to treating the situation in a manner like one would playing the game of Monopoly: seeking to hasten the bankruptcy of one's opponent. Could this explain the craziness developing between rivals HP and Dell?

Some argue the increase in M&A is a bullish sign. Were this so, though, would not banks be lending, venturing to capture a fair share of companies whose equity is judged undervalued? Indeed, was this not the order of things up until the securitization bubble popped?

Poor Bernanke and Geithner. They still believe the old order (and its infinite multiplier) can be restored. Their promise to flood the world with liquidity that is increasingly finding less "paper" and more "things" attractive is setting up for the mother of all imbalances whose name is hyperinflation. Yet that this is in fact a physical process and not a monetary one will become plainly evident by way of increasing scarcity: this as a result of countless businesses being driven into the ground, unable to bear costs soon-to-be astronomically rising.

Still, our idiot regulators will not let up, and this despite being called to account by way of high-profile dissent among their own, the likes of whom understand the end of the great paper chase over the past several decades is at hand. If these Monetarist Monkeys are not safely removed, we're screwed ... and sooner than most dare imagine.


Fast Money
* * * * *

© The Risk Averse Alert — Advocating a patient, disciplined approach to stock market investing. Overriding objective is limiting financial risk. Minimizing investment capital loss is a priority.

Analysis centers on the stock market's path of least resistance. Long-term, this drives a simple strategy for safely investing a 401(k) for maximum profit. Intermediate-term, investing with stock index tracking-ETFs (both their long and short varieties) is advanced. Short-term, stock index options occasionally offer extraordinary profit opportunities when the stock market is moving along its projected path.

Nothing is set in stone. Nor is the stock market's path of least resistance always known. More often than not, there are no stock index option positions recommended.


There's an easy way to boost your investment discipline...

Get Real-Time Trade Notification!

Thursday, August 26, 2010

A View More Technically Justified


Yesterday's view needs adjusting. Something covered a few weeks ago advises this.


NYSE McClellan

The McClellan Oscillator's July burst had been called "third wave like." I want to keep with this view. Thus, the wave count variation above is thought better technically justified.

Whether wave c ends wave (b) of B, though, is up in the air. Well enough for now is it could.

This week's continuation of selling that began on August 9th no doubt is weakening the market's technical state. This confirms the tone of trading we are seeing, as there appears considerable difficulty holding any bid.

Given the manner in which weakness in fact is persisting, it seems unlikely the market's early-August peak might soon be challenged. Still, my view remains a bounce is due ... once five waves down from August 9th's peak have completed. It is not yet apparent the fifth and final wave lower has run its course.


Fast Money
* * * * *

© The Risk Averse Alert — Advocating a patient, disciplined approach to stock market investing. Overriding objective is limiting financial risk. Minimizing investment capital loss is a priority.

Analysis centers on the stock market's path of least resistance. Long-term, this drives a simple strategy for safely investing a 401(k) for maximum profit. Intermediate-term, investing with stock index tracking-ETFs (both their long and short varieties) is advanced. Short-term, stock index options occasionally offer extraordinary profit opportunities when the stock market is moving along its projected path.

Nothing is set in stone. Nor is the stock market's path of least resistance always known. More often than not, there are no stock index option positions recommended.


There's an easy way to boost your investment discipline...

Get Real-Time Trade Notification!

Wednesday, August 25, 2010

A July 2009 Redux, But Notably Weaker


Noted yesterday was still positively trending momentum. This condition supports the likelihood of an upcoming bounce.


$SPX

Looking back to the late-2008, early-2009 period we see a similar momentum configuration (MACD) had developed going into early-July, 2009. As it turned out, a third wave [higher] in the market's counter-trend rally off March '09 bottom subsequently unfolded.

I bring this up because a "third wave" in the market's counter-trend rally since late-May 2010 could be on the verge of developing...


$SPX

It's the old a-b-c-x-a-b-c subdivision of wave (b) of B of (B).

Wave c — a "third wave" — of (b) could unfold during the market's prospective bounce upcoming.

If you look closely at MACD on the first chart above plotting the S&P 500 over the past two years, you will notice momentum's acceleration during advancing periods since March '09 bottom persistently faded — a condition continuing right up to the present moment. So, just how "powerful" might be wave c of (b) upcoming could prove rather faint.

Curiously enough, too, the S&P 500's price action during each successive advance since late-May bottom subtly reveals a similar degradation of upward acceleration. Each successive advancing period has taken more time to complete. So, you have to wonder whether any upcoming bounce might extend into October.

If you didn't catch the first five minutes of tonight's Fast Money, check it out because, listening to the observations of traders on the desk, you get the sense that, desire to put money to work is meeting what are thought favorable conditions. Absent any financial basket case dropping dead, the animal spirits seemingly present on the desk might make for suitable conditions for raising capital among those moribund white shoes who simply cannot gut government revenue streams fast enough.


Fast Money
* * * * *

© The Risk Averse Alert — Advocating a patient, disciplined approach to stock market investing. Overriding objective is limiting financial risk. Minimizing investment capital loss is a priority.

Analysis centers on the stock market's path of least resistance. Long-term, this drives a simple strategy for safely investing a 401(k) for maximum profit. Intermediate-term, investing with stock index tracking-ETFs (both their long and short varieties) is advanced. Short-term, stock index options occasionally offer extraordinary profit opportunities when the stock market is moving along its projected path.

Nothing is set in stone. Nor is the stock market's path of least resistance always known. More often than not, there are no stock index option positions recommended.


There's an easy way to boost your investment discipline...

Get Real-Time Trade Notification!

Tuesday, August 24, 2010

Patiently Anticipating Collapse


As bad as today was (with a gap lower and an increasingly dour mood throughout the day), there's enough reason to think everything is not about to fall apart over days ahead.


OEX 5-min

An Elliott 5-wave channel with a lower parallel to the third wave remains intact. However, the fourth wave indicated above might move to Monday's early morning peak.

In wondering where next — where might an upcoming bounce lead — the evidence is mixed. Today's gap lower and 5-minute RSI extreme — producing the weakest reading yet since August 9th top — suggests any upcoming bounce likely will be restrained.


$OEX

The market's upward momentum (as measured by MACD) remains intact, thus raising the likelihood a bounce lies ahead.


$NYAD

This likelihood is increased by the market's improved, internal performance over the past couple weeks.

I'm just not sure how dynamic the market's upcoming bounce might be. It could be more so than seems likely given today's further deterioration. Right now, the market appears to be transitioning to the downside, but more technical evidence is needed to raise the probability of an upcoming collapse putting March '09 lows in the cross hairs.


Fast Money
* * * * *

© The Risk Averse Alert — Advocating a patient, disciplined approach to stock market investing. Overriding objective is limiting financial risk. Minimizing investment capital loss is a priority.

Analysis centers on the stock market's path of least resistance. Long-term, this drives a simple strategy for safely investing a 401(k) for maximum profit. Intermediate-term, investing with stock index tracking-ETFs (both their long and short varieties) is advanced. Short-term, stock index options occasionally offer extraordinary profit opportunities when the stock market is moving along its projected path.

Nothing is set in stone. Nor is the stock market's path of least resistance always known. More often than not, there are no stock index option positions recommended.


There's an easy way to boost your investment discipline...

Get Real-Time Trade Notification!

Monday, August 23, 2010

Ever a Disaster Just Waiting to Happen


Judging by today's trading it will take approximately another year to finally reach the objective put forward last week...


OEX 5-min

The "you are here" marker hasn't moved...


OEX 5-min

This is not to say a "like from like" second wave is a virtual certainty, as technical weakness by some measures only grew today.


$OEX

Suddenly, the market's technical condition bears similarity to late-April. However the present state of things appears notably weaker. Of course, this is rather fitting considering what's in store.

Nevertheless, a bounce still seems in order here.


Fast Money
* * * * *

© The Risk Averse Alert — Advocating a patient, disciplined approach to stock market investing. Overriding objective is limiting financial risk. Minimizing investment capital loss is a priority.

Analysis centers on the stock market's path of least resistance. Long-term, this drives a simple strategy for safely investing a 401(k) for maximum profit. Intermediate-term, investing with stock index tracking-ETFs (both their long and short varieties) is advanced. Short-term, stock index options occasionally offer extraordinary profit opportunities when the stock market is moving along its projected path.

Nothing is set in stone. Nor is the stock market's path of least resistance always known. More often than not, there are no stock index option positions recommended.


There's an easy way to boost your investment discipline...

Get Real-Time Trade Notification!

Friday, August 20, 2010

A Strong Technical Case for a Head and Shoulders Top


It looks like a head-and-shoulders top is just about to complete its formation on the NYSE Composite index...


$NYA

The volume configuration is key. A head-and-shoulders top is a distribution pattern — marking a transfer of shares from strong hands to weak — so, you want to see volume diminishing during formation of the right shoulder.

This requirement ties into the adage, "Prices can fall of their own weight, but it takes buying to put them up." Strong hands (possessing power to drive prices ever higher) naturally will be increasing their purchases following a markdown. When they're not, you can assume their positions have been distributed (in the case of a head and shoulders top during formation of the left shoulder and head). Without the backing of strong hands (which condition is revealed by muted volume during formation of the right shoulder), prices are vulnerable to falling of their own weight.

Momentum's configuration (MACD - bottom panel) appears to be confirming distribution as well. Weak hands — either hanging on for dear life (probably a widespread phenomenon these days) or possessing misplaced optimism — are adding no selling pressure. Nor are strong hands. These have been distributing shares, not adding to their position. So, accelerating momentum during advancing phases of a head and shoulders top's formation might naturally become increasingly evident, much as we see in this case.


$BPNYA

Added confirmation of increasing underlying weakness such as one might expect during formation of a head and shoulders top is presented via the Bullish Percent Index. Lovely.


NYSE McClellan

Ditto the McClellan Oscillator and Summation Index. Per the Oscillator, the deceleration of selling pressure is leading to its successive increase from left shoulder to right shoulder.

Now the question is how soon will come the neckline's downside penetration? With the McClellan Oscillator diverging this week versus last ... the Summation Index remaining on the positive side of its range ... and 5 and 10% Indexes likewise positive and diverging ... it appears a decent bounce could develop before a strong turn lower leading to downside penetration of the head and shoulders' neckline follows.


NYA 5-min

Sticking with the NYSE Composite index, it is not at all certain that, five waves down from August 9th top have unfolded. If, however, these five waves down ended today, then with failure to channel to the third wave's parallel, a measure of underlying support might, in fact, exist here and lead to a fairly strong push higher over coming days — this in keeping with yesterday's point of view (seen via the OEX).

Given a solid case strong hands are done distributing shares, and the appearance of an ominous head and shoulders top — technically well-substantiated — the hour draws near for the first serious retest of March 2009 bottom.


Fast Money
* * * * *

© The Risk Averse Alert — Advocating a patient, disciplined approach to stock market investing. Overriding objective is limiting financial risk. Minimizing investment capital loss is a priority.

Analysis centers on the stock market's path of least resistance. Long-term, this drives a simple strategy for safely investing a 401(k) for maximum profit. Intermediate-term, investing with stock index tracking-ETFs (both their long and short varieties) is advanced. Short-term, stock index options occasionally offer extraordinary profit opportunities when the stock market is moving along its projected path.

Nothing is set in stone. Nor is the stock market's path of least resistance always known. More often than not, there are no stock index option positions recommended.


There's an easy way to boost your investment discipline...

Get Real-Time Trade Notification!

Thursday, August 19, 2010

Weakness Confirmed


Today's weakness resulted in something unexpected: technical confirmation indicating weakness is increasing. I was rather expecting technical divergences indicating some measure of underlying strength building, thus raising the likelihood that, highs reached earlier this month might be exceeded (how ever slightly) during the market's anticipated, upcoming bounce.

So, let's consider the possibility the market's forecast decline slated to challenge March 2009 lows, indeed, has begun...


$OEX

As you can see, RSI confirmed today's decline and MACD fell ever so slightly into the negative. These both indicate weakness is persisting.

Likewise, that today's volume exceeded volume over the past week while last week's losses were being consolidated further indicates weakness is not diminishing.

Still, today's volume was in fact a little lighter than that coinciding with last Wednesday's gassing (8/11/2010). Thus, selling precipitating the market's decline over the past two weeks apparently is becoming exhausted: a conclusion in keeping with yesterday's observation that, long equity positions are being hedged to a degree suggesting a bounce might be in store.

So, the fifth wave of five waves down from August 9th peak appears to have unfolded today. These five waves lower could mark the first wave down of five larger waves slated to challenge March 2009 lows. Either that, or another a-b-c "zig zag" down presently is unfolding (like what formed during the latter half of June, but one degree larger), with wave "a" completing today.


OEX 5-min

Just as wave ii filled a gap created during the formation of wave i, wave 2 might similarly fill a gap created during the formation of wave 1. This could result in major indexes bouncing right back up to the vicinity of 200-day moving averages (coincidentally enough).


$CPC

Another repeating CBOE Put/Call Ratio pattern for your consideration, supporting the present outlook for a decent bounce straight ahead.

If my "you are here" on the 5-minute chart of the OEX above is correct, then the initial portion of the market's upcoming bounce could prove fairly indecisive. Likewise, the greater bulk of the expected move back up to 200-day moving averages could develop rapidly thereafter, and set up for an even bigger fall.

Whether this fall likely will produce wave 3 of (c) or another "c" wave in the formation of wave (b) presently is uncertain. I rather suspect the latter, yet the technical state of things at that moment is likely to offer some useful clues.


Fast Money
* * * * *

© The Risk Averse Alert — Advocating a patient, disciplined approach to stock market investing. Overriding objective is limiting financial risk. Minimizing investment capital loss is a priority.

Analysis centers on the stock market's path of least resistance. Long-term, this drives a simple strategy for safely investing a 401(k) for maximum profit. Intermediate-term, investing with stock index tracking-ETFs (both their long and short varieties) is advanced. Short-term, stock index options occasionally offer extraordinary profit opportunities when the stock market is moving along its projected path.

Nothing is set in stone. Nor is the stock market's path of least resistance always known. More often than not, there are no stock index option positions recommended.


There's an easy way to boost your investment discipline...

Get Real-Time Trade Notification!

Wednesday, August 18, 2010

Patient Bears Sees Long Equity Hedging Signaling a Bounce


Over the course of about the past year ... as the market's counter-trend rally off March '09 bottom came nearer its peak ... and then turned over ... there have been bottoms from which the market has bounced ... and these are in focus tonight.


$OEX

All of the noted bottoms save one (May 7, 2010) were lows set within a counter-trend rally. That's the common theme here.

This matters because within the market's counter-trend rally states over the past twenty months there appears a well-established measure of long equity hedging coinciding with the above noted bottoms...


$CPC

And here we are again.


OEX 5-min

Be that as it may, added pressure might appear before ultimate bottom is reached. Still, with hedging of long equity positions via put options elevated here, it's more likely any prospective challenge of recent lows will be defended.

Is the immediate urgency to raise capital weak hands have been experiencing lessened now that Treasury is actively seeking to install new engines powering the Bernanke helicopter fleet?


Fast Money
* * * * *

© The Risk Averse Alert — Advocating a patient, disciplined approach to stock market investing. Overriding objective is limiting financial risk. Minimizing investment capital loss is a priority.

Analysis centers on the stock market's path of least resistance. Long-term, this drives a simple strategy for safely investing a 401(k) for maximum profit. Intermediate-term, investing with stock index tracking-ETFs (both their long and short varieties) is advanced. Short-term, stock index options occasionally offer extraordinary profit opportunities when the stock market is moving along its projected path.

Nothing is set in stone. Nor is the stock market's path of least resistance always known. More often than not, there are no stock index option positions recommended.


There's an easy way to boost your investment discipline...

Get Real-Time Trade Notification!

Tuesday, August 17, 2010

The Rag Doll Market, by Franklie Valium


You just know that, with today's similarity to May 2008 identified — this at a time when omens appear and banshees run rampant — something different likely will develop and end yesterday's noted similarity with conditions at the precipice in 2008. This outcome, indeed, seems much more the rule, rather than the exception.

So what will it be? Collapse immediately? Or prolong this rag doll's levitation? They sure are tossing this thing around.

No news of an imminent, systemically threatening bankruptcy, so let's go with the latter. Enough for the moment is the rush to safe paper and physical resources amidst an escalating need to bail out toxic securities choking the financial system. Clearly, the seams of our tattered rag doll are near bursting wide open.


OEX 5-min

You have to love how weak hands now in control are raising capital. With a floor set during the first five minutes of trading the rest of the day simply was spent bleeding suckers. Only supply enough to leave intact the floor established shortly after the market's open was offered up this afternoon. Evidently (as should be expected) the takers proved to be even weaker hands than those starving for capital.

I am rather expecting a bit more selling pressure and possibly a [positive] technical divergence or two developing before any move back up to the area of 200-day moving averages develops. The trip higher could be rather choppy I suspect. There's only so much abuse even a sucker can take. Diminishing upside volume so far over the course of this year rather convincingly suggests this.


Fast Money
* * * * *
© The Risk Averse Alert — Advocating a patient, disciplined approach to stock market investing. Overriding objective is limiting financial risk. Minimizing investment capital loss is a priority. Analysis centers on the stock market's path of least resistance. Long-term, this drives a simple strategy for safely investing a 401(k) for maximum profit. Intermediate-term, investing with stock index tracking-ETFs (both their long and short varieties) is advanced. Short-term, stock index options occasionally offer extraordinary profit opportunities when the stock market is moving along its projected path. Nothing is set in stone. Nor is the stock market's path of least resistance always known. More often than not, there are no stock index option positions recommended. There's an easy way to boost your investment discipline... Get Real-Time Trade Notification!

Monday, August 16, 2010

Confirming the Hindenburg Omen


I did not learn about this until today, but apparently something called "The Hindenburg Omen" was signaled last Thursday. Based on the internal characteristics of trading in NYSE-listed stocks, the omen apparently elevates the potential for a financial market crash.
"This is not to dismiss the indicator, but like all good technical analysis, the signals from one indicator should be verified using signals from another indicator that measures the same events in a different way," Guppy said.

Oh yeah, we have a whole lot of that going on around here now, don't we. Indeed, we do.

Elliott wave possibilities suggesting March '09 lows might soon be challenged, bolstered by a mid-term election cycle going back at least 25 years suggesting an intermediate-term low upcoming (probably before election day) and internals contrasting NYSE with NASDAQ revealing animal spirits AWOL offer such verification I believe.

Still, any prospective, upcoming gassing could be but a prelude of far worse yet to come over the next few years.

No doubt, March '09 lows likely will be defended, and this for as long as another white shoe firm does not threaten to fall. Yet fall another white shoe firm (or two) probably will, as a great leverage unwind invariably proceeds along a course predestined by the actions of pigs whose gluttonous feeding up until recently virtually guarantees their slaughter by the hand that fed them.

Surely, the lessons of 2008 bear this probability out.


$NYA

Duly noted are present similarities to a major inflection point back in '08. One ever-so-slight difference now versus then, though, is seen in the configuration of momentum (MACD).

Back in late-May '08 when a similarly sharp break from a counter-trend rally peak unfolded momentum already had begun turning over a couple weeks earlier (i.e. in early-May 2008). In the present instance, however, there really was no similar warning.

Now, on one hand this slight difference stands to reason, given the different place we are right now within the context of an Elliott corrective wave begun in October 2007. We are further along in this corrective wave's formation, with the worst yet to come lying only all the nearer. So, last week's more sudden turn lower — relatively without warning — might be thought fitting the moment.

Nevertheless, should present technical similarities persist it appears a trip back up to the 200-day moving average is in order here. Whether such a move will satisfy my present outlook (anticipating wave c of an a-b-c zig-zag up from June 29th bottom) remains to be seen.

All told the Hindenburg remains intact. Yet you would have to be either naive or brain dead not to be aware of the highly charged air in which the ship presently is traveling. In light of this the cry, "Oh, the humanity!" very much still remains a purposeful misdirection's awful possibility.


Fast Money
* * * * *
© The Risk Averse Alert — Advocating a patient, disciplined approach to stock market investing. Overriding objective is limiting financial risk. Minimizing investment capital loss is a priority. Analysis centers on the stock market's path of least resistance. Long-term, this drives a simple strategy for safely investing a 401(k) for maximum profit. Intermediate-term, investing with stock index tracking-ETFs (both their long and short varieties) is advanced. Short-term, stock index options occasionally offer extraordinary profit opportunities when the stock market is moving along its projected path. Nothing is set in stone. Nor is the stock market's path of least resistance always known. More often than not, there are no stock index option positions recommended. There's an easy way to boost your investment discipline... Get Real-Time Trade Notification!