Albert Schweitzer here.
Today ve vill play z'adult wersion of put z'pegs in z'holes.
Alright look. The case long ago was made January's steep decline and March's retest should have had underlying technical character much weaker than was shown last summer when the stock market first came unglued (July - August '07). A rightful capitulation (as they say in Virginia) is something one rightly expects before a natural retracement of a five-year stock market advance (2002-2007) is completed. Such a thing as a capitulation sweeping the financial nation is confirmed by conditions revealed under the covers. So far... nothing.
Then, too, there's the Elliott Wave view supporting an outlook anticipating the strongest stock market decline yet in the present, multi-month correction. Indeed, not only is this well within the realm of possibility, it is likely. And its greater probability has been growing with each passing day... almost incredibly.
It is a relative rarity when certainty continues for an extended period. Yet, mine continues still.
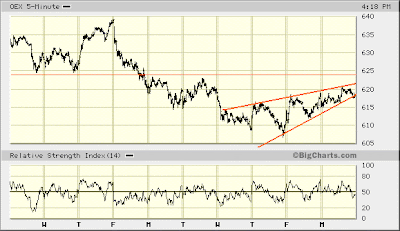
When you look at the charts below ... check out RSI and MACD similarities ... now and early January '08. This is the round peg in the round hole test. Do you see what comes next?

Then, look closely at volume since the May 19, 2008 peak ... particularly on down days. Note it being elevated above what registered on most every declining day since the March 17, 2008 low ... and its growth as declines since May 19th have deepened.
The trend is your friend. A crisis of confidence and deer in the headlights are how I have described trading volume's character over the course of the market's advance from March 17, 2008. Now, the crisis of confidence is meeting interested sellers. We'll call this the crescent moon peg. Power to drive the market higher is being eclipsed.

The very same crisis of confidence also presents itself the past three days. If strong hands were buying last Thursday's bottom, volume might not be declining quite so decidedly as the market has risen ... particularly since sellers recently have demonstrated a heightened interest in doing business. The tricky star peg! Turn it until it fits.
And did you notice the greater degree to which the high-cap S&P 100 has been getting drained, relative to all securities traded on the Big Board affecting the NYSE Composite?

You see again, too, how the proven stock exchange for pump and dump schemes is holding up best of all.
Why, this might just mean selling pressure has a long, long way to go. Look at similar circumstance over the entire duration since last summer. Whenever NASDAQ lagged a downturn, this consistently signaled negative prospects whose end saw the NASDAQ Composite sliding more than the others (in percentage terms).
Therefore, since there appears to be a confluence of solid technical reason to expect a good deal more selling, NASDAQ's lag seems only to be adding to the probability. The simple square peg in the square hole.

I wish I could pound the table with something saying all this anticipated selling is but moments from breaking onto the scene.
However, I am afraid I can't. (Still, I am optimistic about a couple June OEX 600 Puts.)


A similar display of well-contained bounces are not lending much clue revealing when the pooh might leave the zoo on the U.S. stock exchange.
Seems there could be more upside. Or it could all come unglued tomorrow morning...

Pop Quiz.
Given price-RSI performance and volume characteristics revealed in the 10-year chart of Goldman Sachs, what might we expect soon after GS announces earnings Tuesday morning?
You'll know the answer if you've been paying attention these past couple months...
* * * * *
© The Risk Averse Alert — Advocating a patient, disciplined approach to stock market investing. Overriding objective is limiting financial risk. Minimizing investment capital loss is a priority.
Analysis centers on the stock market's path of least resistance. Long-term, this drives a simple strategy for safely investing a 401(k) for maximum profit. Intermediate-term, investing with stock index tracking-ETFs (both their long and short varieties) is advanced. Short-term, stock index options occasionally offer extraordinary profit opportunities when the stock market is moving along its projected path.
Nothing is set in stone. Nor is the stock market's path of least resistance always known. More often than not, there are no stock index option positions recommended.
 There's an easy way to boost your investment discipline...
Get Real-Time Trade Notification!


