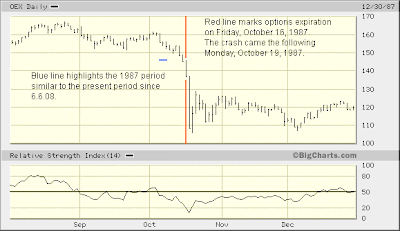
I am starting to wonder whether the stock market's meltdown has already begun ... whether last Friday's steep sell-off kicked off the big move down I have been anticipating for some weeks now. Were this the case, then no last-gasp rally to the 647 area in the S&P 100 lies in wait.
Still ... imminent collapse might be delayed some days. Indeed, the greater bulk of the stock market's meltdown probably will not occur until after next Friday's June OEX contract expiration. How soon, though, until the market turns hard lower I cannot say.

You might want to open the above chart in a new window, so you can take a closer look at the S&P 100's performance leading up the the crash of Monday, October 19, 1987. It bears a marked similarity to the present period.
The last time I presented this same chart was Friday, May 16, 2008 ... just one day before the S&P 100 topped. If you go back and look, you will see I marked the chart "You Are Here." Although I was wrong to suggest, price-wise, the S&P 100 on May 16, 2008 stood about at the same point as it did on October 2, 1987 ... RSI-wise, I was right on (see the OEX Weekly chart posted on 5.16.08).

So, consider how the S&P 100's initial, five day move lower from its 5.19.08 peak is like its initial decline from its August 25, 1987 top through early-September, 1987. In both instances the S&P 100's RSI broke below 50, indicating sell-side strength prevailing. Likewise, in neither case did the S&P 100's RSI reach a sell-side extreme, where you might naturally become alert to a solid bottom likely being near to forming.
Following the S&P 100's initial break lower from respective peaks set on 8.25.87 and 5.19.08, the index consolidated for a time. Note how RSI rebounded to find balance between buy-side and sell-side strength (i.e. at 50) in both instances.
Now, it is still possible the present period might be likened to the last eight days of September 1987. This would suggest a last-gasp advance to 647 in the S&P 100 might still develop. However, given how poorly trading has developed so far this week, I wanted to raise a red flag here.

I have made reference to June OEX open interest in my Mr. Market Twitter a couple times this week. I should detail the situation here. I have to assume (at least for right now) there is a vested interest whose better interest does not wish the S&P 100 to fall much further from here.
To wit: today the S&P 100 closed at 618.99. Combining June OEX open interest at just three strikes below the market (i.e. 615, 610, an 605) there are a measly 507 Call contracts open and 12,197 Put contracts open. So, if the S&P 100 fell to 600, just 507 contracts would be taken out-of-the-money and 12,197 would be moved in-the-money. One would thing the writers of those Put contracts would not be happy campers.
Thus, we might assume there's a vested interest wishing to keep a bid under the S&P 100, not allowing the index to fall much further going into next Friday's expiration.
Granted, this analysis is simplistic. It does not take into account all the varied scenarios which might make the disparity between Call and Put open interest immediately below the market less seemingly stark. Yet, the disparity is quite evident nevertheless, and so probably worth noting.
Now, above the market we have a situation far more in balance. Call open interest in June OEX contracts from the 620 to the 645 strikes is a combined total of 19,092 contracts. Put open interest is 22,703 contracts.
Thus, there's nothing from an open interest perspective discounting the possibility the S&P 100 might still find its legs. So, there's still hope the present moment could be similar to the latter half of September 1987, when the S&P 100 embarked on a last-gasp advance just prior to going into a death spiral.
Right now, I feel it could go either way. Furthermore, even if a bounce higher remains in store, I am not yet convinced a bottom to the decline that began last Friday (6.6.08) is in. But you've been around long enough to know how it goes with me. Everything could become clear as day in as little as a New York minute...
* * * * *
© The Risk Averse Alert — Advocating a patient, disciplined approach to stock market investing. Overriding objective is limiting financial risk. Minimizing investment capital loss is a priority.
Analysis centers on the stock market's path of least resistance. Long-term, this drives a simple strategy for safely investing a 401(k) for maximum profit. Intermediate-term, investing with stock index tracking-ETFs (both their long and short varieties) is advanced. Short-term, stock index options occasionally offer extraordinary profit opportunities when the stock market is moving along its projected path.
Nothing is set in stone. Nor is the stock market's path of least resistance always known. More often than not, there are no stock index option positions recommended.
 There's an easy way to boost your investment discipline...
Get Real-Time Trade Notification!


1 comments:
tom, todd harrison on minyanville has a nice saying that goes w/your comments:
"...that risk management trumps reward-chasing."
nice post, thanks!
Post a Comment