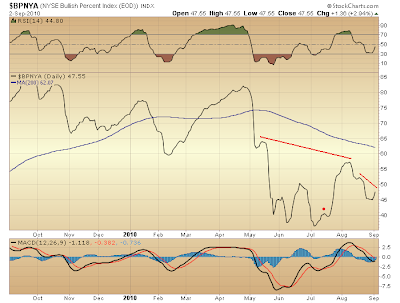
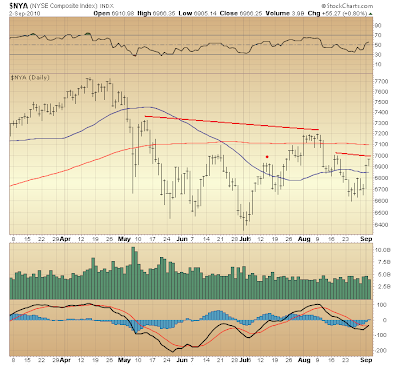
Once again we see a relative handful of NYSE-listed issues are doing all the heavy lifting...

The markup you see above is drawn for comparative purposes...

Plainly, weakness continues building. You might look back to the market's mid-July peak and notice a similar condition to now, wherein relatively few NYSE-listed issues were behind the market's advance off early-July bottom, much as is seen the case over the past few days.
Now, following mid-July's brief setback further selling apparently was restrained, setting the stage for suckers to snap up a wider swath of listed issues, and in the process light up the NYSE Bullish Percent Index. (That this proved a poor decision was made obvious in August.)
Notice, though, that technical conditions in mid-July were on many fronts improving (for example, you can see this via the NYSE's RSI and MACD). So, following mid-July's setback a further move higher was technically justified.
The case presently is quite the contrary. Technical conditions are deteriorating. So, don't expect a repeat performance further lifting the NYSE Composite, as well as the NYSE Bullish Percent Index.
Now, we might look forward here to a few days spent levitating, such as could lead to a wider swath of NYSE-listed issues turning the corner (per the NYSE Bullish Percent Index). Yet any prospective technical improvement probably will find circumstance raising suspicion that, it is occurring only in time for the market's subsequent collapse. By all appearances we are at the brink of what could be a nasty turn lower.

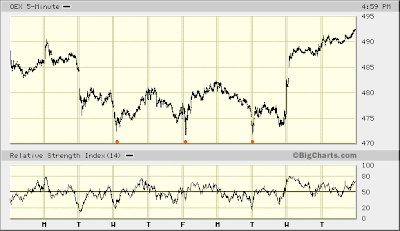
Any one of the bottoms indicated above could mark the end of the fifth wave down from August 9th.
Yesterday I suggested Tuesday's bottom ended wave v. Yet what if its end were thought last Friday, or Wednesday before that? This is a relevant question because the market's advance off Tuesday's bottom sure passes for an Elliott "c" wave of an a-b-c corrective wave up — a 3-3-5 "flat."
Today's follow-through to yesterday's advance leads one to view the move up since Tuesday's bottom as a 5-wave form, rather than a 3-wave form (i.e. a-b-c). These five waves up are thought forming wave c [of an a-b-c correction of five waves down from August 9th].
With that established, then, it is hard to say whether wave 3 of c is completed yet. Wave 4 of c likely will weaken RSI to a degree more than was the case during formation of wave 2 of c (Tuesday). No such weakening even close has occurred yet. Thus, my uncertainty about wave 3 of c completion ... and my strong suspicion a few days more levitating are in store.
Duly noted is the downward bias of wave 2 of c on Tuesday and the prospect wave 4 of c might have an upward bias. We saw this consistently during the formation of five waves up from March '09 bottom. Be that as it may, RSI during formation of upcoming wave 4 of c should challenge its Tuesday low. Then, we will know how very close, indeed, the market might be to the precipice.

* * * * *
© The Risk Averse Alert — Advocating a patient, disciplined approach to stock market investing. Overriding objective is limiting financial risk. Minimizing investment capital loss is a priority.
Analysis centers on the stock market's path of least resistance. Long-term, this drives a simple strategy for safely investing a 401(k) for maximum profit. Intermediate-term, investing with stock index tracking-ETFs (both their long and short varieties) is advanced. Short-term, stock index options occasionally offer extraordinary profit opportunities when the stock market is moving along its projected path.
Nothing is set in stone. Nor is the stock market's path of least resistance always known. More often than not, there are no stock index option positions recommended.
 There's an easy way to boost your investment discipline...
Get Real-Time Trade Notification!


