Some quick comments on the market's short-term prospects...
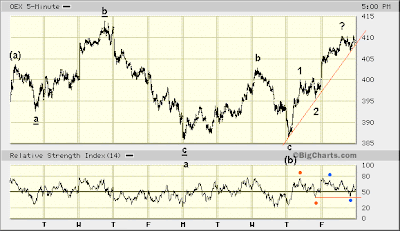
I mentioned yesterday in a Mr. Market Twitter, "4th wave of 5 waves up from yesterday's low will complete when 5-min RSI falls below yesterday's @ 3:00 p.m." Let's take a closer look at this.

Typically, RSI registered during formation of a 4th wave (of 5 waves up) will worsen from that registered during formation of the 2nd wave preceding it. Well, if yesterday's mid-day peak (see ?) marked the end of wave 3 (of 5 waves up from Thursday morning), then a prospective 4th wave presently forming has not yet seen RSI registering a reading worse than what registered during the formation of wave 2 (ending Thursday @ 3:00 pm).
Now, this could happen first thing Monday morning. Or, contrarily, the market could rocket higher right out of the gate, thus raising the probability the market's advance following wave 2's completion is but wave i of 3.
RSI as it presently stands very much supports this possibility. If ? is wave 3, then RSI associated with this 3rd wave — typically the most dynamic Elliott Wave — certainly fails to reveal lopsided buy-side interest, such as pushes RSI into "extreme" territory (above 80) ... much as one might expect during the formation of wave 3 of (c).
So, in addition to a typical 4th wave versus 2nd wave RSI configuration being absent thus far, relatively atypical RSI performance associated with a "third wave of a third wave" (i.e. wave 3 of (c) prospectively unfolding Friday) also suggests the best of the market's advance over the past couple days is yet to come.
Keep in mind, too, the RSI configuration I am highlighting here — 4th wave versus 2nd — is typical. In other words, there is nothing set in stone about this analytical angle using RSI to help identify a five-wave, Elliott impulse wave.
All disclaimers aside ... broad market indexes are behaving similarly to the S&P 100, and so furthering the probability the market could explode higher Monday. There simply is nothing revealed by Composite Index performance challenging analysis presented here.


Now, a word about the bigger picture...
Going back to Monday, January 26th, you see the day's afternoon sell-off — following what had been a positive lift off bottom a day earlier — dragging RSI to the vicinity of a sell-side extreme (i.e. 20). This led me to suspect the market's melt-up was likely being delayed.
Thus, my assumption a [rising] (a)-(b)-(c) wave is forming off bottom set on January 23, 2009. This wave is projected to continue the market's sideways trade over the past couple months. Although appearing likely to carry indexes to a new high (post-November bottom), a final pullback following its completion is expected.
The wave count I have indicated above likewise could be subject to change. It is possible wave (b) has yet to complete. Be that as it may, you get the picture. The market appears poised to rise a good bit further, near-term.
* * * * *
© The Risk Averse Alert — Advocating a patient, disciplined approach to stock market investing. Overriding objective is limiting financial risk. Minimizing investment capital loss is a priority.
Analysis centers on the stock market's path of least resistance. Long-term, this drives a simple strategy for safely investing a 401(k) for maximum profit. Intermediate-term, investing with stock index tracking-ETFs (both their long and short varieties) is advanced. Short-term, stock index options occasionally offer extraordinary profit opportunities when the stock market is moving along its projected path.
Nothing is set in stone. Nor is the stock market's path of least resistance always known. More often than not, there are no stock index option positions recommended.
 There's an easy way to boost your investment discipline...
Get Real-Time Trade Notification!


