 |
| NYSE Composite (weekly) 2003-2013 |
It's our contention the NYSE Composite Index in October 2007 completed a 5-wave advance from its 1974 bottom. Likewise, these five waves up from 1974 formed a 5th wave completing a 5-wave advance from 1932.
Now, if October 2007, indeed, represents the major top we have reason to believe it is, then if five waves down unfolded from October 2007 to March 2009, there is no possibility of the NYSE Composite rising above its October 2007 peak. So, forming off March 2009 bottom is a "b" wave of an a-b-c down from October 2007 peak.
What, specifically, do we see unfolding since March 2009? Is it an a-b-c-x-a-b-c, "complex" Elliott corrective wave (in this case a "double zig-zag")? Or are waves "a" and "b" and now "c" of a triangle (whose "d" and "e" waves yet remain) unfolding? Possibly some other Elliott corrective wave? Say, a 3-3-5 "flat" forming since February 2011 peak whose "b" wave presently is developing, while still awaiting completion with a turn down to depths possibly even challenging March '09 bottom?
Yes, this is our preferred view presently. Recall the technical backdrop coinciding with the Dow Jones Industrials Average's fluctuations over recent years. We have much reason to suspect the durability of the market's present advance. "Something's not right" is well-communicated by every technical measure coinciding with the market's levitation particularly since early-October 2011 bottom. This is a typical "b" wave quality.
Rather stunning, too, is the work of a one-sided support group frantically marking up garbage listed the NYSE...
 |
| Cumulative NYSE Advance-Decline line 2007-2010 |
Here we see a measure suggesting the NYSE Composite long ago should have surpassed its October 2007 peak. Still, the index remains considerably south of it. We have been noting this disparity for just about as long as it has been evident. Proof that weak hands are behind the market's levitation is objectively demonstrated by this disparity.
As we all know, too, it's not like every scam in the book isn't being used to feign confidence. Indeed, the NYSE cumulative advance-decline has remained on nothing but a terror as a result...
 |
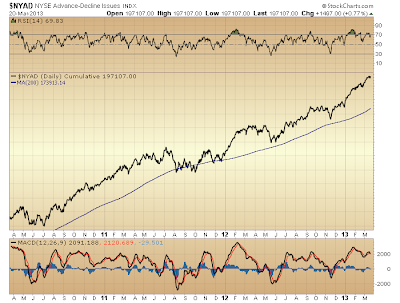
| Cumulative NYSE Advance-Decline line 2010-2013 |
Good God! Just imagine what will happen when this one-way street reaches its end! If this is what it takes to keep the NYSE Composite limply elevated, then once there's no more pavement on which to race imaginary money machines (the likes of which just about every financial asset class under the sun has been transformed into by reckless central banks) only one outcome likely remains: a nasty, nasty crash.

* * * * *
© The Risk Averse Alert — Advocating a patient, disciplined approach to stock market investing. Overriding objective is limiting financial risk. Minimizing investment capital loss is a priority.Analysis centers on the stock market's path of least resistance. Long-term, this drives a simple strategy for safely investing a 401(k) for maximum profit. Intermediate-term, investing with stock index tracking-ETFs (both their long and short varieties) is advanced. Short-term, stock index options occasionally offer extraordinary profit opportunities when the stock market is moving along its projected path.
Nothing is set in stone. Nor is the stock market's path of least resistance always known. More often than not, there are no stock index option positions recommended.
 There's an easy way to boost your investment discipline...
Get Real-Time Trade Notification!


