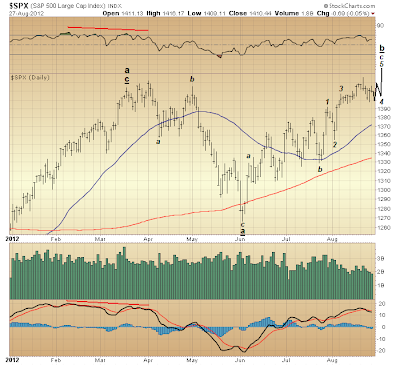
There is a good chance the market's advance since early-June still has legs...

Sticking with the view put forward here last week in "Confidence on Holiday Still Matters Most," still in progress appears formation of the "c" wave of an a-b-c "zig-zag" up from early June. Making this prospect likely is the state of both the S&P 500's relative strength (top panel) and its momentum (bottom). We are likely to see a deterioration of these two technical measures coincident with the S&P 500's pending top. This is typical technical behavior marking tops not only over the duration since March '09, but generally speaking. Noted above are incidents of this earlier this year.
It would stand to reason other major indexes probably will extend into new high territory, post-March '09 bottom, as well. Subsequently, however, there is every reason to suspect a trip south approaching last year's lows will commence. The market's technical state more broadly speaking is positively abysmal — a condition indeed persisting over the past couple years.
One thing you can say about the market's continued, death defying resiliency over the duration is that, projections anticipating exceptional market weakness increasingly coincide with an internal effect evoking diminishing confidence in their probability. That said, though, there is ample reason to suspect upcoming weakness could prove even worse than last year's, and furthermore result in last year's lows being exceeded. Considering that the market's technical state last summer had in fact deteriorated from that preceding the May 2010 flash crash, and has only but further weakened, there is good reason to fear the worst case scenario in the context of the Elliot wave-based view put forward here last week.
As such, too, there is a possibility the market's pending top could prove the ultimate high reached off March '09 bottom. Being that the second "three" of an a-b-c-x-a-b-c Elliott corrective wave (i.e. the second "a-b-c") is thought forming a 3-3-5 "flat" — this alternating from the 5-3-5 "zig-zag" forming the first "three" off March '09 bottom — wave c of this "flat" might fall short of the peak about to be set in formation of the flat's wave b. This is entirely within the realm of Elliott wave possibility per formation of "flat" corrective waves. Given the market's poor technical state, this possibility might be better thought, indeed, rather probable instead.

* * * * *
© The Risk Averse Alert — Advocating a patient, disciplined approach to stock market investing. Overriding objective is limiting financial risk. Minimizing investment capital loss is a priority.
Analysis centers on the stock market's path of least resistance. Long-term, this drives a simple strategy for safely investing a 401(k) for maximum profit. Intermediate-term, investing with stock index tracking-ETFs (both their long and short varieties) is advanced. Short-term, stock index options occasionally offer extraordinary profit opportunities when the stock market is moving along its projected path.
Nothing is set in stone. Nor is the stock market's path of least resistance always known. More often than not, there are no stock index option positions recommended.
 There's an easy way to boost your investment discipline...
Get Real-Time Trade Notification!


