You might have missed it, but to yesterday's post I added a long-term view of the NASDAQ Composite presenting overhead resistance the index is bumping against. This resistance is all the more noteworthy in the face of NASDAQ's weakening relative strength over the past five years.
Per NASDAQ's monthly RSI still being positively poised above 50 (just like the Dow Industrials), my takeaway is strong hands would not be so revealing following a prolonged period of relative strength weakness — weakness that, indeed, only was the more confirmed at March '09 bottom. Rather, some prolonged period finding RSI basing below 50 would be more typical coincident technical circumstance raising probability of a sustained advance upcoming (this, of course, to be driven by strong hands causing RSI's basing in the first place).
Strong hands would not be giving away an intention that, today might be thought decidedly positive on account of monthly RSI remaining above 50. It's my contention weak hands instead are being afforded a moment to make something of the game. From this view, then, monthly relative strength's weakening over the past five years is rather ominous. Likewise, a blow-off top is better thought the lesser probability against a panicked race for the exits, such as could hit from practically out of nowhere at any minute.
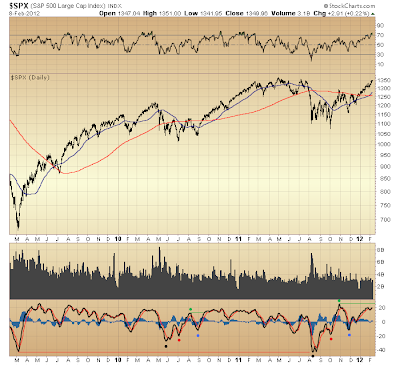
On daily scale, too, do we find significant technical distinction that, separates strong hands from weak. Once again we find the latter in command...

A couple weeks ago or so I mentioned a qualitative difference in the market's present bounce recovering from August's disaster contrasted to the market's bounce following the May 6, 2010 "flash crash" and its immediate aftermath, a bounce commencing late-June 2010. Via the S&P 500's daily MACD (bottom panel) this contrast can be detailed. Exposed at present is a greater relative presence of weak hands, this as the S&P 500 challenges its 2011 peak.
Both periods saw a similar, positively diverging bottoming process (see black, then red dots), then subsequently parted ways. During the S&P 500's initial lift off late-June 2010 bottom its momentum peaked well below its late-April 2010 peak. Contrarily, the S&P 500's initial lift off early-October 2011 bottom saw its momentum blow out its early-July and early-May 2011 peaks.
In the former instance strong hands well-disguised their capacity to carry the market higher. However in the current instance the mask is off. Weak hands are being herded for fleecing. Momentum's divergence, now versus late-October 2011, looms quite large, particularly in the face of other, accumulated technical disparities prior to early-October 2011 bottom.
Contrast MACD now, as the S&P 500 presently challenges its peak off March '09 bottom, to its position when in early-November 2010 the S&P 500 had breached its April 2010 peak. By the slightest margin MACD confirmed this early-November 2010 breach. This likewise followed early-September 2010 MACD confirmation of the S&P 500's further lift off late-June 2010 bottom, as the index exceeded its early-August 2010 peak. Of note here, too, is that late-June 2010 bottom saw a positive MACD divergence from its late-May 2010 depths, which itself was well above the depths MACD reached in March '09.
What we saw in 2010's post- flash crash turn higher was relative trepidation persisting amidst an increasingly constructive technical backdrop (per MACD). So, once April 2010 peak was exceeded (early-November 2010), the market's subsequent follow-through was, technically, a well-substantiated probability. All the more as the S&P 500's momentum remained positive (i.e. MACD above 0) coincident with S&P 500's November 2010 pullback.
The situation now (per MACD) is markedly different from 2010. Trepidation? There's none. Not in the initial lift off early-October 2011 bottom, nor in subsequent follow-through since mid-December. There's only negative divergence at the height of hope in hyperinflationary happiness for as far as the eye can see. This negative divergence is revealed via the market's lift off early-October 2011 bottom, both in how momentum during advancing states technically relate, as well as how its entirety contrasts to technical developments since March '09 bottom.
On this latter account momentum's surge following October 2011 bottom presents another objective piece of evidence suggesting weak hands simply being played. As circumstance in 2010 amply demonstrated, a stronger interest possessing some staying power is more apt to temper its "enthusiasm," while at the same time lending underlying strength to the market's legs.
Considering presently negative momentum divergences (see daily charts) in the context of weakening long-term relative strength (see monthly charts), immediate prospect finds more likely a sudden collapse, rather than a "blow-off" top. Not to entirely discount this latter possibility, yet its likelihood probably is better thought slim. Rather all eyes should be on momentum. Once it turns negative, look out below.

* * * * *
© The Risk Averse Alert — Advocating a patient, disciplined approach to stock market investing. Overriding objective is limiting financial risk. Minimizing investment capital loss is a priority.
Analysis centers on the stock market's path of least resistance. Long-term, this drives a simple strategy for safely investing a 401(k) for maximum profit. Intermediate-term, investing with stock index tracking-ETFs (both their long and short varieties) is advanced. Short-term, stock index options occasionally offer extraordinary profit opportunities when the stock market is moving along its projected path.
Nothing is set in stone. Nor is the stock market's path of least resistance always known. More often than not, there are no stock index option positions recommended.
 There's an easy way to boost your investment discipline...
Get Real-Time Trade Notification!


