Contrary to last night's suggestion that, a scalping of options premium in a range bound trade might be upcoming over the next week, the market's technical state rather is bad enough that, rapid downward assertion further confirming the beginning of the end could instead be at hand...

That's the weekly S&P 500 over the past three years ... whose momentum (bottom panel) is juuust turning negative, and hard, after persistently fading since February 2011 peak. Momentum-wise, big picture, there's a lot to lose. Relative strength (top panel) confirms this. Indeed, within the realm of reasonable probability, it seems — judging by technical shockers earlier this week — is the S&P 500's weekly relative strength exceeding its worst in October '08, and sooner rather than later.
Since an Elliott wave C is thought unfolding — again a third wave typically being most dynamic, according to the Elliott Wave Principle — even during its initial leg lower, there could be shocking, technical devastation. As we saw on Monday, the likes already have been delivered.
Which brings us to the interesting area of intermediate-term support shown via the green line drawn above. There is reason to believe this line of support might be tested sooner rather than later...

Satan still burns red. No less does his disposition, then ($BPNYA RSI <30), welcome stocks further into Hades.
As you will now see, insurance stocks need to bide time in limbo has not yet been forthcoming...

Still no worthy spike in long equity positions being hedged with put options. With damage already done this month, hedging enough to suggest a firm bottom is in place no doubt should exceed that seen at May 2010 bottom. There is every reason to believe more hedging will be required before there is any prospect of a "bottom" being at hand.
So far, no sign of bottom. In fact, on a couple occasions over the past eighteen months the CBOE Put/Call Ratio has been similarly disposed as now. In both instances another leg lower in the market immediately followed.
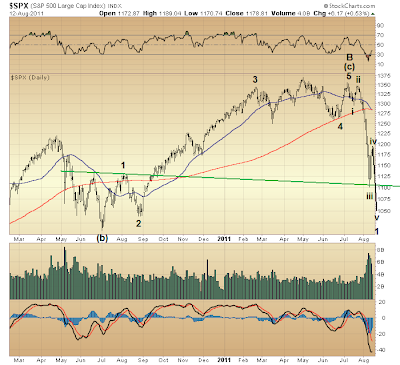
So, the S&P 500 might be on rapid course to meeting its intermediate-term support at 1050-ish. This week's respite might prove short-lived. There's no reason why the fifth and final wave forming five waves down from July 7th peak could not rapidly unfold next week...

As I just demonstrated, technical evidence very well supports this probability.
On the S&P 500's daily chart there is a similar line of support, much the same as was seen on its weekly chart, having more or less the same precedents during its development. So, the market's behavior once this line of support turns to resistance is worth keeping an eye on.
Should resistance be maintained once support at 1100 is violated (prospectively next week), then support at 1050, itself, could soon afterward turn resistance, too. I'm picturing formation of a so-called "running correction" as wave 2 forms, as two lines of former support turn to battle tested resistance.
Subsequently, wave 3 could rip right through March '09 lows by way of a breathtaking collapse, probably coinciding with the EMU's demise — a likelihood increasingly heard to be inevitable.
The point is on this Friday night the market's upcoming undoing could proceed at a speed more rapid than everyone seems capable of imagining (this, too, is circumstance making collapse all the more likely). Of course, technical developments as current lines of support turn to resistance will need assessment in their own time. Right now, it is enough that, the first line of support could be toast next week, given the market's current technical state discussed above.
* * * * *
© The Risk Averse Alert — Advocating a patient, disciplined approach to stock market investing. Overriding objective is limiting financial risk. Minimizing investment capital loss is a priority.
Analysis centers on the stock market's path of least resistance. Long-term, this drives a simple strategy for safely investing a 401(k) for maximum profit. Intermediate-term, investing with stock index tracking-ETFs (both their long and short varieties) is advanced. Short-term, stock index options occasionally offer extraordinary profit opportunities when the stock market is moving along its projected path.
Nothing is set in stone. Nor is the stock market's path of least resistance always known. More often than not, there are no stock index option positions recommended.
 There's an easy way to boost your investment discipline...
Get Real-Time Trade Notification!


