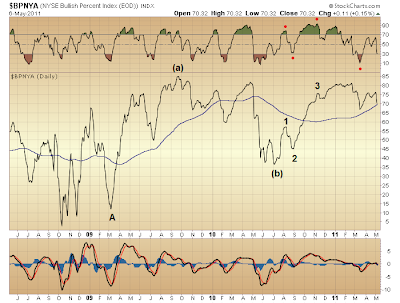
Here is technical perspective substantiating the Elliott wave count applied to the market's counter-trend rally off March '09 bottom, this as it nears its end...

Consistent divergence the NYSE Bullish Percent Index has registered since late-June 2010 (relative to the NYSE Composite's performance) supports the idea that, the market's counter-trend rally since March '09 is, in fact, nearing its end.
Yet the relatively more dynamic technical character one might expect during formation of a third wave — in this case wave (c) of an a-b-c corrective wave up from March '09 bottom, forming since late-June 2010 — although not revealed by the NYSE Bullish Percent Index itself, instead is substantiated via relative strength (top panel) applied to the NYSE Bullish Percent Index. As you can see, the NYSE Bullish Percent Index's relative strength peaked during formation of wave 3 of (c) — a third wave of a third wave — going into early November 2010.
Already during formation of wave 4 of (c) relative strength of the NYSE Bullish Percent Index has fallen below the low it registered during formation of wave 2 of (c). This presents a manifestation of technical deterioration typical as a 5-wave advance nears its end. Much the same is revealed by the greater bulk of technical measures accompanying the market's advance off late-June 2010 bottom, as well as March 2009 bottom before that.
Now, seeing the NYSE Bullish Percent Index's relative strength presently in an area where over the past two-plus years market weakness has coincided — this I noted back in March — one wonders whether completion of wave 4 of (c) along lines mentioned yesterday might be in order. Thus, a fairly sharp decline completing wave 4 of (c), and likewise setting up a fifth wave failure, could be signaled by the NYSE Bullish Percent Index's relative strength falling below 30.
As for today's rumblings warning of Greek debt deflation (a.k.a. "restructuring"), the lesson learned during the Bear Stearns-to-Lehman debt deflation fiasco of 2008 simply is that, first, policy options are limited in their capacity to mitigate financial collapse ... and second, as for these, another liquidity gusher is out of the question sans a terrible panic.
By all [technical] measures and [Elliott wave] counts, such a precarious state of affairs remains the one thing pending whose elevated probability demands exclusive attention notwithstanding the market's resiliency.
* * * * *
© The Risk Averse Alert — Advocating a patient, disciplined approach to stock market investing. Overriding objective is limiting financial risk. Minimizing investment capital loss is a priority.
Analysis centers on the stock market's path of least resistance. Long-term, this drives a simple strategy for safely investing a 401(k) for maximum profit. Intermediate-term, investing with stock index tracking-ETFs (both their long and short varieties) is advanced. Short-term, stock index options occasionally offer extraordinary profit opportunities when the stock market is moving along its projected path.
Nothing is set in stone. Nor is the stock market's path of least resistance always known. More often than not, there are no stock index option positions recommended.
 There's an easy way to boost your investment discipline...
Get Real-Time Trade Notification!


