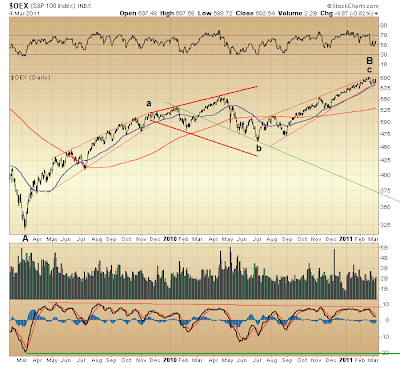
With current technical similarities to April 2010 top persisting — this following a levitation more long-lasting, yet technically less robust, than that preceding April 2010 top — awaiting further confirmation is an outlook supposing that, the market's counter-trend rally off March '09 bottom has ended, and a dive to levels last seen in the 1987-1994 period lies in store. This awaits but follow-through to February 22nd's drubbing...

Just how soon might manifest the more or less unmistakable, negative consequence of the market's prolonged levitation amidst deteriorating technical conditions presently remains uncertain. Indeed, an eye-opening swoon like that on May 6, 2010 might not develop as rapidly in the present instance because, in fact there now is everything to lose with trouble appearing on all horizons, no matter if bailout of a hopelessly insolvent trans-Atlantic financial system continues or instead is forced to end on account of its feeding an accelerating economic dislocation precipitating growing social upheaval.
Given that weak hands are thought dominating long equity interest — this state of affairs more or less having been solidified during the market's counter-trend rally off March '09 bottom, following a broad distribution over the preceding decade — then every bit of selling restraint as has persisted for many months now might continue during this present, early stage of the market's projected hard turn lower, as nothing on the horizon makes for clear sight of a lucrative proposition worth gaming. Unlike last May — when in the midst of discussion about a "Fed exit strategy" a contrary clamor begging for additional quantitative easing found in the euro-zone a vulnerability to be profitably exploited — there presently appears nothing to be gained shaking out weak longs in anticipation of another tranche of bailout (whose end in fact otherwise would be nowhere in sight, were the present mound of insolvent claims not already doomed from here on out only to grow into a mountain of woe, this for as long as the maintenance and expansion of mere speculative capital — so called "gambling debts" — continues taking precedent to the urgent imperative requiring massive investment in physical economy).
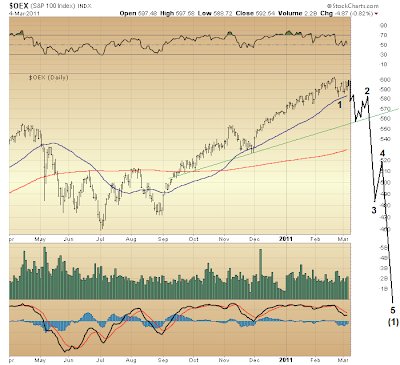
So, that upcoming "dance" around the 50-day moving average I mentioned the other day might progress along lines indicated on the above chart. Yet part of me wonders, too, whether what is labeled wave 2 might prove but wave a of 2 ... with wave b of 2 replacing a large part of what is labeled wave 3, and wave c of 2 replacing wave 4 (and then some). In other words, this manner of unfolding would enlarge the "running correction" I have indicated on the chart above as the form wave 2 might take.
The point is that, the market's projected decline might unfold only with increasing devastation, with each lurch lower followed by an only more modest recovery, relatively speaking, leaving those expecting something more positive holding positions much too long, thus placing themselves at risk of being forced to capitulate at unthinkable levels far, far lower.

Returning to one technical nuance of my outlook discussed some months ago — a matter of circumstance whose achieving would serve to confirm the probability of serious trouble ahead...
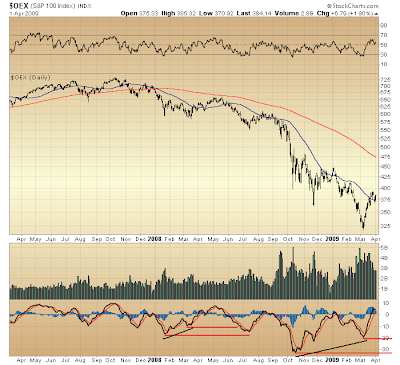
Just prior to the moment when the very worst of the market's upcoming decline will be set to unfold we should first see momentum (bottom panel) take out its March '09 low (yet remain above its October '08 bottom?), then recover, and thus mimic underlying conditions from May '08 - September '08 preceding the market's collapse in October.

It remains to be seen, though, if in the present instance formation of the first and second waves of five waves down (these targeting levels last seen in the 1987-1994 period) will result in March '09 bottom being taken out.
Given the similar manner in which momentum divergences formed in March '08, then again in March '09 — this, as first waves down completed — and seeing how in the first instance a subsequent, negative momentum challenge (July '08) proved rather foreboding (October '08), another similar challenge likewise warning of further, serious trouble immediately ahead rightly should be expected, then, particularly given the magnitude of the market's anticipated decline upcoming.
The manner in which this momentum challenge occurs might in fact prove technically consequential, too. For example, consider the market's decline from May-July '08. In taking out the prior March low with momentum confirming this negative move, not only was October '08 technically "foretold," but so too was risk of the decline before us. This risk only became weightier with all manner of technical confirmation accompanying 2008's collapse. Yet though the market's projected, upcoming throttling could prove historic, the occasion, itself, could begin evidencing such momentum divergences as would support a 1932-like bottom possibility. That, I believe, is what lies on the immediate horizon.
So, in a quiver of technical divergences supporting the case for such a prospective bottom might first go the projected, upcoming negative momentum challenge of March '09 low (bottom panel) coinciding with formation of the first and second waves down (of five waves targeting levels last seen in the 1987-1994 period) ... possibly unfolding in a manner as described at the start ... and remaining above March '09 bottom. Unlike 2008, then (when July's negative momentum challenge was confirmed by a new index low, post-October 2007 top), the projected, upcoming momentum challenge could develop while indexes remain above respective March '09 lows, thus presenting a positive technical divergence first sign whose furthering (such as would technically substantiate a major bottom) eventually would await the market's ultimate decline to levels last seen in the 1987-1994 period.
Taking a different perspective, the Elliott Wave Principle's "alternation" guideline similarly suggests that, the March '09 low initially might hold while a negative momentum challenge like that made in July '08 registers during upcoming formation of the first and second waves down from February 18, 2011 top, thus alternating present, relative circumstance from that recent, prior instance in forming the first two waves of five waves down.
There's no telling whether this perspective's presentation might be premature once again. Yet given that suspect underlying conditions — that is anything but bullish — remain intact, as does evidence of a top presented by the extraordinary manner in which a "rising wedge" off late-June 2010 bottom found technical confirmation right up to its presumed end on February 18, 2001, thus are odds raised that, initiation of one of the nastiest periods in the history of the U.S. stock market could be in progress, with nothing but endless disappointment awaiting the larger mass of investors who rather perceive a sea of bailout money as offering easy passage to some great treasure, whereas in truth the only thing bought and paid for is a ticket to hell by way of a hyper-inflationary-induced, global physical breakdown calamity.

* * * * *
© The Risk Averse Alert — Advocating a patient, disciplined approach to stock market investing. Overriding objective is limiting financial risk. Minimizing investment capital loss is a priority.
Analysis centers on the stock market's path of least resistance. Long-term, this drives a simple strategy for safely investing a 401(k) for maximum profit. Intermediate-term, investing with stock index tracking-ETFs (both their long and short varieties) is advanced. Short-term, stock index options occasionally offer extraordinary profit opportunities when the stock market is moving along its projected path.
Nothing is set in stone. Nor is the stock market's path of least resistance always known. More often than not, there are no stock index option positions recommended.
 There's an easy way to boost your investment discipline...
Get Real-Time Trade Notification!


