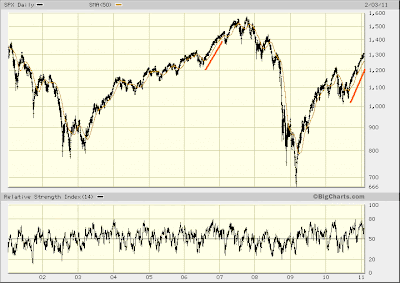
According to Ryan Detrick, chief technical strategist at Schaeffer's Investment Research, there's something very significant about the market's run since the start of September. As of last week the S&P 500 traded above its 50-day moving average for 100 straight trading days. This has happened only five time previously since 1980.
Detrick's claim is that, this is a bullish indicator. Of course, I beg to differ...
First, Detrick's reference to 2006 certainly is questionable in the context of the larger frame of reference circumstance leads me to develop and present in these parts. Beyond this, though, let's look closer at how this present instance compares with 2006.

Now, one present qualitative difference versus 2006 is seen via RSI. In 2006 tighter balance is displayed in relative strength's ascent coinciding with the market's advance over the latter half of that year and into 2007. Generally speaking, when there is technical balance coinciding with an advance, then there probably will be occasion for some imbalance, or weakness, to develop before the market tops.
Presently, relative strength is displaying a subtly different character off late-June 2010 bottom. More or less the same fits and starts — short squeeze initiated rallies followed by distribution into weak hands — characterizing the entirety of the market's rally off March '09 bottom continue being displayed by the S&P 500's relative strength index.
Nevertheless taking the whole of the past seven months into view, there is a certain measure of relative strength balance to be seen, too. Not nearly as tight as in 2006, still, taking into account a fair similarity, along with common circumstance surrounding the S&P 500's 50-day moving average, there is a case for concluding Elliott waves of a similar character have unfolded in each instance.
To whit in both cases an Elliott third wave is seen forming. Both relative strength balance and the S&P 500's most-postive relationship with its 50-day moving average present that measure of "dynamism" typical of Elliott third waves.
In 2006 the third wave of the fifth wave of five waves off October 2002 bottom formed. Off late-June 2010 bottom another third wave — wave c of an a-b-c corrective wave up from March '09 — continues unfolding.
So, in refutation to Detrick's claim that, last week's 100th consecutive day finding the S&P 500 trading above its 50-day moving average is "a bullish indicator" ... we should better conclude this circumstance useful only in helping to clarify an Elliott Wave view which, itself, is technically well-substantiated by other measures as well.
From this perspective presently ... the outlook is more frightfully bearish than most dare ponder.
Yet there's a nuance to Detrick's analysis I must humbly give deference to. He notes that, since 1980, markets 80% of the time still were positive two months following the S&P 500's 100th day above its 50-day moving average, and up an average of 3.33%. Furthermore, the market still was positive three months out 60% of the time.
Assuming a "rising wedge" has been forming off late-June 2010 bottom, two months from now the market most definitely will not be higher.
Yet time being a most precious commodity these days, what presently appears a technically well-confirmed "rising wedge" might not come to be. Rather a more typical Elliott five-wave advance still might develop, extending the market's levitation in such a way as satisfies expectations formed by Detrick's analysis. This alternate Elliott wave perspective (nevertheless still forming wave c of an a-b-c corrective wave up from March '09 bottom) would anticipate completion of the fourth and fifth waves of five waves up from late-June 2010 — a process levitating the market a few more months that Detrick's immediate expectation might be met.
Yet risk risen by a "rising wedge" forming wave c of an a-b-c corrective wave up from March '09 bottom rather immediately threatens. Whether this risk, indeed, comes to pass should become apparent within the next week or two at most.
* * * * *
© The Risk Averse Alert — Advocating a patient, disciplined approach to stock market investing. Overriding objective is limiting financial risk. Minimizing investment capital loss is a priority.
Analysis centers on the stock market's path of least resistance. Long-term, this drives a simple strategy for safely investing a 401(k) for maximum profit. Intermediate-term, investing with stock index tracking-ETFs (both their long and short varieties) is advanced. Short-term, stock index options occasionally offer extraordinary profit opportunities when the stock market is moving along its projected path.
Nothing is set in stone. Nor is the stock market's path of least resistance always known. More often than not, there are no stock index option positions recommended.
 There's an easy way to boost your investment discipline...
Get Real-Time Trade Notification!


