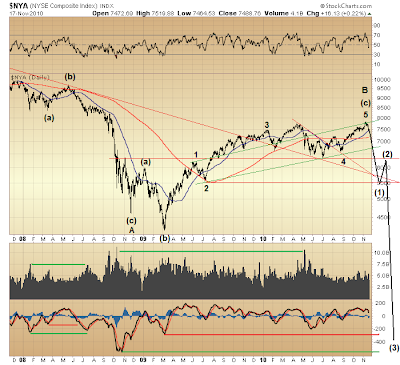
The prospect that, top is in — a major top at that — and a throttling for the ages has commenced — albeit but in its embryonic state — finds more compelling evidence supporting the probability...

First, though, an apology for not labeling the Elliott wave count on the same chart above presented yesterday. There it is. As I said, there's considerable technical support raising this probability. More on this in a second, after a disclaimer...
Even if a collapse taking major indexes to levels last seen in the 1987-1994 period eludes reality over months ahead, the market's present technical condition strongly supports the likelihood of a pullback to the area where various lines of support drawn above converge. This is in the vicinity of July '09 bottom.
So, if wave (1) of C down is not presently in its early stages of development, then a [smaller] "c" wave down continuing what otherwise might be seen a topping process evolving since Q4 '09 has a high probability of unfolding in its stead. Which will be, I imagine, might not be clear either, following this upcoming pullback.
Indeed, there was not a great deal of clarity toward what lied ahead at July '08 bottom. Then, capitulation I had been anticipating seemed stretched at the conclusion of the market's decline from May '08 peak. There was evidence of it, but not overwhelming. Of course, capitulation came soon after, but its probability was difficult to project at July'08 bottom, as well as during the bounce thereafter.
In some manner we might likewise expect a measure of uncertainty following this projected, upcoming decline to levels last seen in July '09. Yet being further along in the market's corrective wave down since October 2007 top has its advantages. With more accumulated evidence we have greater capacity to isolate possibilities.
And have we evidence that five waves up from March '09 bottom completed just days ago! This is important, because with this, we can say a 3-3-5 "irregular flat" from November '08 bottom has ended, and a nasty, five-wave collapse has a high probability of developing over months ahead...

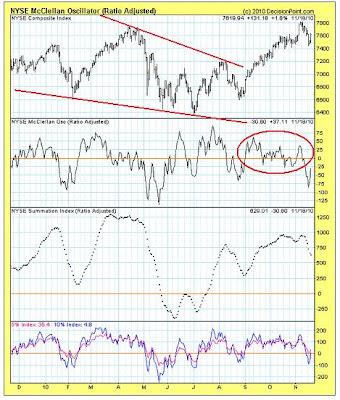
Focus on the McClellan Oscillator's performance during the market's advance off late-August bottom. Is this better thought coincident with a 3rd wave or a 5th wave? The answer, of course, is the latter. So, rather than coinciding with some "c" wave (a corrective wave's 3rd wave) that is part of some larger corrective wave seen unfolding over the past many months, the market's advance from late-August is justifiably seen the fifth wave of five waves up from March '09 bottom.
Consider, too, the oscillator's behavior prior to this advance. Its deterioration at the start of the year challenged its reading at March '09 low, and then in May even exceeded it. Such technical deterioration during formation of 4th waves, indeed, is typical.
Per the oscillator's spike up from May bottom ... look what it took to produce a steady trickle of suckers thereafter!
And now it is falling apart...

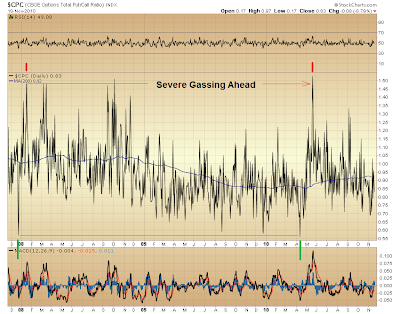
Extreme swings in the CBOE Put/Call Ratio noted above are a curiosity. Of course, what has evolved in the current instance differs from 2008. Yet the position in which the market is seen (given the new and improved Elliott wave count isolating a 3-3-5 corrective wave off November '08 bottom) finds nothing but fright in the Put/Call Ratio's behavior, here at the precipice of an anticipated, historic decline to levels last seen in the 1987-1994 period.
Returning to previously mentioned uncertainty at July '08 bottom, we have enough evidence to anticipate conditions during formation of wave (1) of C. My guess is a greater measure of what appears capitulation will develop. This will differ from what was the case in July '08.
So, upcoming weakness might appear extreme, resulting in technical measures "oversold" to a degree only comparable to 2008's worst. Given that a "buy on dips" mentality cultivated over many decades is very much still alive — all the more enforced with the March '09 save, and its "new normal" finding undying support from the lender of last resort — and given "the game" ... well, we have seen what can be manufactured in a second wave's position (take wave B from November '08 to November 2010, for example).
Likely well-masked will be the coming wave (3) of C, just as occurred in the summer of '08.

* * * * *
© The Risk Averse Alert — Advocating a patient, disciplined approach to stock market investing. Overriding objective is limiting financial risk. Minimizing investment capital loss is a priority.
Analysis centers on the stock market's path of least resistance. Long-term, this drives a simple strategy for safely investing a 401(k) for maximum profit. Intermediate-term, investing with stock index tracking-ETFs (both their long and short varieties) is advanced. Short-term, stock index options occasionally offer extraordinary profit opportunities when the stock market is moving along its projected path.
Nothing is set in stone. Nor is the stock market's path of least resistance always known. More often than not, there are no stock index option positions recommended.
 There's an easy way to boost your investment discipline...
Get Real-Time Trade Notification!


