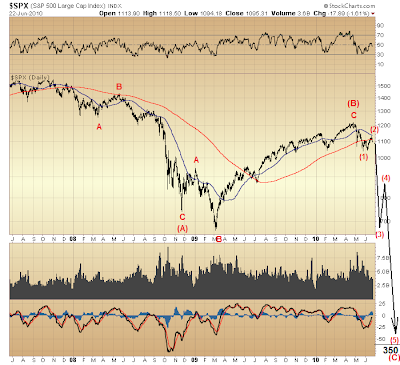
Considering the critical importance of March '09 lows to those in the bailout camp, an alternate Elliott Wave view toward what lies ahead might offer a more fitting perspective harmoniously aligned with what has come to pass over the last decade.
Although it might seem ridiculous to think appearances are everything, a violation of March '09 lows is rather likely to signify bailout is failing. Thus, it seems likely that, upon any retest of March '09 lows some attempt at maintaining appearances of the viability of the bailout regime in all probability will be coordinated by those who have both nothing and everything to lose.
Now, simply imagine what relatively large number of suckers will boldly take the bait upon a coming, "successful" retest of March '09 lows. This likelihood leads to a key point I want to make today...
The next few years, and quite possibly longer, should bring to a crescendo a trend that has become increasingly severe over the past ten plus years — one featuring massive financial failure of an historically unprecedented kind. Thus, cause to line up as many suckers as possible during each new phase of an inexorable spiral into the abyss is likely to continue creating nothing but bull traps until such time as both the will and the wherewithal of every last sucker has been effectively vanquished.
Bear in mind this process already has been well underway over the past ten years. Yet, even now, what do we continue seeing? That's right, suckers with both the will and the wherewithal to get in the way of an out-of-control freight train barreling down the tracks at ever-increasing speeds.
Indeed, seen in this light the market's counter-trend rally off March '09 bottom is not even the first bull trap set during the course of a Great Distribution over the past decade. The first bull trap developed from October 1998 to Y2k top. The second was from October 2002 to October 2007.
The market's rally from March '09 to April '10 is seen marking the third bull trap in just over a decade.

So, in keeping with tonight's bull trap theme — or, more accurately, refining it — consider the above Elliott wave count.
What's "different" from recent projections only is how wave (C) — assumed to have begun at late-April top — is labeled. As you can see, wave (5) of (C) might prove the only part of the market's pending, steep decline to unfold decisively below March '09 low.
Up to now it was thought wave (3) of (C) would smash through March '09 bottom. Yet the above manner of unfolding might more effectively trap the greatest number of suckers at the highest possible prices. If you think about it, hasn't this been the trend over the past ten years?
The bull trap set from March '09 to April '10 threatens to be sprung with wave (3) down — a move that appears imminent. However, this will not be the last bull trap before ultimate bottom is reached sometime over the next few years.
There will be wave (4) ... with accompanying hype claiming a successful retest of March '09 bottom. However this bull trap will be exposed during the formation of wave (5).
Then, once wave (C) is completed (bottoming somewhere in the vicinity of levels last seen in the 1980s), an initial advance off bottom — unlikely to be thought prospectively long-lasting — in all probability will be largely retraced, more or less cementing disillusionment naturally born of all preceding bull traps over the past 10+ years (those past and those yet to spring).
Although this initial advance off wave (C) bottom technically will not be a bull trap, by that time it more likely will be thought so ... resulting in a true bottom retest, and this just prior to an explosive advance. By then, today's suckers will be vanquished, the financial media shell shocked, and the market poised to skyrocket.
I'm getting way ahead of myself, but you get the picture.
One other point I want to make about the prospective Elliott wave count indicated above...
When you get a chance, take a look at price action at the end of the bear markets of 1929-1932 and 1973-1974. Both these very large swoons had one thing in common that is of particular note here. Both ended with a bang. Selling into bottom was swift and devastating. As you can see above, the same is projected in the present instance ... with wave (5) of (C) prospectively serving up the greatest pain in the market's decline from April 2010 top.
As generally is the case here when price projections are drawn, my intention is to present highlights of what might likely lie ahead. Although the dimension of various, projected moves reflect my sense of what to expect, the timing of these is better assumed not "drawn to scale."
For example, you might get the sense from the above S&P 500 chart that, wave (4) of (C) might quickly unfold and soon be followed by wave (5). However, what I rather intend simply is to show wave (4)'s very probability ... and that, too, it is likely to form above the S&P 500's March '09 low. Its form, complexity, and timing remain to be seen.

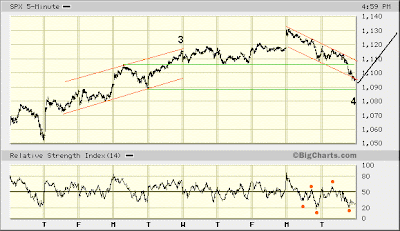
The formation of wave c of (2) [of (C)] is progressing very much as I have been anticipating. Again, assuming yesterday's "Yuan a be a sucker" peak at the open did not complete five waves up from June 1st (forming wave c of (2)), then one last gasp higher might be in store before the March '09 - April '10 bull trap subsequently is sprung.
Let me be blunt. Opportunity to multiply a tiny stake into a fortune rarely ever was greater than is likely to be true over coming days and weeks. So, tell me. How would you like to spend your Christmas this year in Hawaii? I just might be able to get you there for $50.

* * * * *
© The Risk Averse Alert — Advocating a patient, disciplined approach to stock market investing. Overriding objective is limiting financial risk. Minimizing investment capital loss is a priority.
Analysis centers on the stock market's path of least resistance. Long-term, this drives a simple strategy for safely investing a 401(k) for maximum profit. Intermediate-term, investing with stock index tracking-ETFs (both their long and short varieties) is advanced. Short-term, stock index options occasionally offer extraordinary profit opportunities when the stock market is moving along its projected path.
Nothing is set in stone. Nor is the stock market's path of least resistance always known. More often than not, there are no stock index option positions recommended.
 There's an easy way to boost your investment discipline...
Get Real-Time Trade Notification!


