That is, one trading day closer. Now, the question is whether any time remains before the lug nuts fall off.
I mentioned the disparity we have seen since October 2007, NASDAQ vs. NYSE Composite, near turning points leading lower. Let's have a look at this, because given the blinding financial media psy-op you'd think we were in a bull market with legs like Terrell Owens...
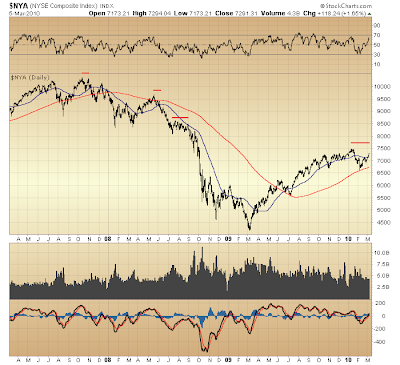
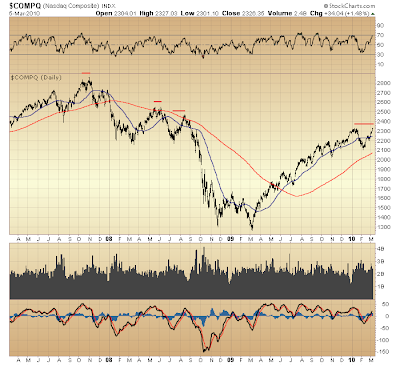
Long-fading relative strength and momentum raise a red flag over NASDAQ's present leadership off early-February bottom.
Upon closer examination, too, there's considerable reason to believe NASDAQ's leadership here will prove fleeting, much as occurred at key inflection points noted above...
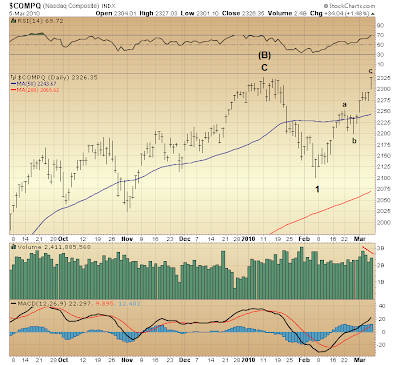
The NASDAQ Composite's January 2010 intra-day high was 2328.27 ... and today, its intra-day high was 2327.03. So, possibility an a-b-c Elliott corrective wave has been unfolding off early-February bottom still lives. However slightly, indeed, it still lives.
For now in the presence of a dual-edged contracting interest — the one venturing to increase its long equity exposure, and the other endeavoring to reduce it — the exit door remains wide open.
Peak volume registering during a "third wave of a third wave" (i.e. wave iii of c, Monday and Tuesday this week) is rather fitting. Likewise, today's fifth wave volume coming up short of third wave volume also is fitting.
Increasing suspicion that, a corrective wave is ending, rather than an impulse wave unfolding is an underlying technical configuration simply reflecting such complacency in certainty as defies the wall of worry...
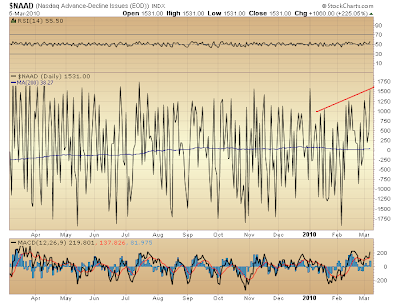
You see performance of NASDAQ's advance-decline differential since early-February bottom coinciding with the a-b-c Elliott corrective wave (up) in a remarkably fitting manner.
More than this, though, we also see an increasing measure of advancing issue participation — first at wave a peak, then today at wave c peak — such as considerably exceeds that registered at mid-January top, and this without even so much as the NASDAQ Composite having broken out above that top.
Look at it this way: were the market about to explode higher, would not this likelihood be much better disguised, rather than appear a certainty, as the trading consensus seems to believe? Said another way... should not such stellar advance-decline readings as presently exceed those registered at mid-January top coincide with an advance unfolding well-above that top?
That such consensus exists prior to any NASDAQ breakout sets up for disappointment, it seems.
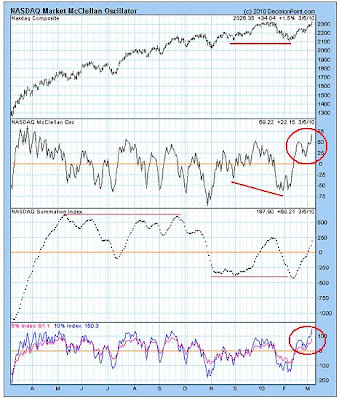
Here, again, is seen a consensus of certainty ... and this following a prolonged period of ever- increasing underlying weakness during the progression of NASDAQ's counter-trend rally off March '09 bottom. This reads: the "correction" is over ... onward and upward from here ... and we are quite sure of it."
I say, "Not so fast, my friend." The character of an Elliott second wave is well-represented by such certainty as we see registering via NASDAQ's McClellan Oscillator. It is as fitting an [oblivious] investment consensus as one might typically expect just prior to a thrashing.
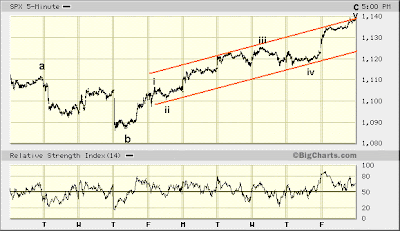
Satisfying yesterday's outlook, we see how today's fifth wave of wave c reached to complete a five-wave Elliott channel. Excellent.
So, then, about today's notable RSI readings...
Were abundant certainty ever more dramatically registered? Relatively speaking, RSI coinciding with wave iii of c at least showed some measure of buy- and sell-side balance. The bulk of today's advance, however, (occurring this morning) unfolded amidst an extreme relative strength imbalance. Then, the manner in which relative strength remained buoyant, displaying no presence of fear, this particularly following a week of solid gains, is seen but further demonstrating that greater measure of certainty one rather could expect to be put to the test. The price-RSI divergence registered late in the day suggests that test could come as soon as Monday.
Finally, for the first time in several months now, OEX call open interest has exceeded put open interest over the entire duration of this week's trading. In other words, someone apparently has been moving to increasingly hedge short equity positions, more or less holding to this while the market rose this week. That no notable expansion in OEX put option open interest occurred during this week's advance — such as otherwise should have narrowed the margin with OEX call open interest — is but another demonstration of misplaced certainty. Weak hands either haven't the resources to hedge their long position, or find no need. Thus, this week's buyers largely appear to be weak hands.
Toward yesterday's closing thought on the possibility mid-January top might be exceeded I have nothing new to add. Suffice it for now that, objective substantiation abounds supporting a view fearing a decline slated to challenge March '09 lows has in fact begun, and indeed, could begin to accelerate toward that objective immediately.

* * * * *
© The Risk Averse Alert — Advocating a patient, disciplined approach to stock market investing. Overriding objective is limiting financial risk. Minimizing investment capital loss is a priority.
Analysis centers on the stock market's path of least resistance. Long-term, this drives a simple strategy for safely investing a 401(k) for maximum profit. Intermediate-term, investing with stock index tracking-ETFs (both their long and short varieties) is advanced. Short-term, stock index options occasionally offer extraordinary profit opportunities when the stock market is moving along its projected path.
Nothing is set in stone. Nor is the stock market's path of least resistance always known. More often than not, there are no stock index option positions recommended.
 There's an easy way to boost your investment discipline...
Get Real-Time Trade Notification!


