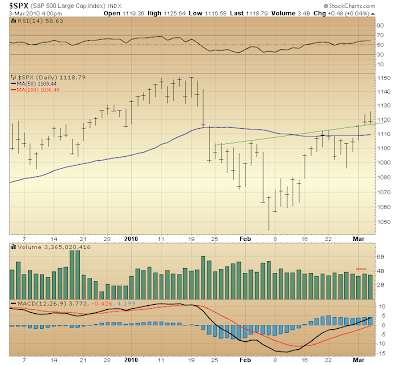
Did Monday-Tuesday this week bring an "inverse head-and-shoulders" break out?

Nyet!
Remember...
"Prices can fall of their own weight, but it takes buying to put them up."
Said "buying" would be reflected by an increased incidence of fear-filled sellers finding their shares snapped up even as prices rise. This critical dynamic signaling share accumulation, however, presently is AWOL. Has been for quite some time now.
Volume spiking upon upside penetration of an inverse head-and-shoulders neckline is prerequisite. Without it, there is no inverse head-and-shoulders — no accumulation.
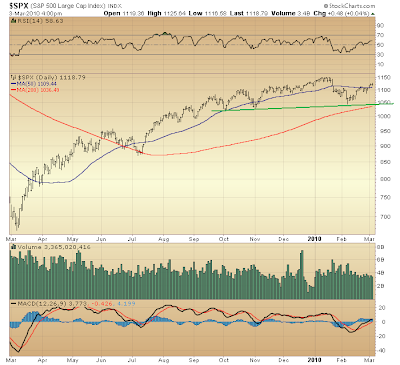
You might recall some folks in July '09 were suggesting the S&P 500 had made a similar neckline penetration of an inverse head-and-shoulders forming since late '08. Same deal then, though (among other disparities). There was no breakout volume registered in July '09 when the supposed neckline was penetrated to the upside. That is why the S&P 500's presumed "minimal objective" in the vicinity of 1200 has yet been reached, and is not likely to be.

Now, there is a prospective head-and-shoulders worth noting: a top — signaling distribution. Weak volume registered during formation of the right shoulder is a nice tip off — indeed, prerequisite.
The neckline's flirtation with the S&P 500's 200-day moving average is interesting, too. You will recall this is the same area around which I am expecting the S&P 500 to revolve in transition lower. Penetration of the neckline of a head-and-shoulders top typically is followed by a reaction back up to the neckline, so anticipation for typical price action associated with a 200-day moving average trend reversal finds some substantiation here, as well.

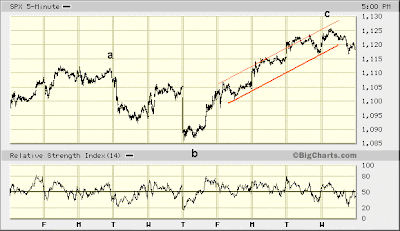
The end of the counter-trend rally off early-February bottom just might have ended before noon today.
It would be fascinating if a head-and-shoulders top were forming over this much shorter interval, too, with yesterday tracing the left shoulder and today the head. The neckline is at the same point of yesterday's gap above that false, inverse head-and-shoulders neckline depicted in the first chart above. Given yesterday's gap higher, too, there's further prospect for a so-called "island reversal" to form ... regardless whether a head-and-shoulders top unfolds here ... so, keep an eye on that as well.
In summary my contention remains that weak upside volume registered for many months now strongly hints that at any moment the bid could evaporate. Thus, the prospective head-and-shoulders top forming over the past six months appears rather foreboding, then.

* * * * *
© The Risk Averse Alert — Advocating a patient, disciplined approach to stock market investing. Overriding objective is limiting financial risk. Minimizing investment capital loss is a priority.
Analysis centers on the stock market's path of least resistance. Long-term, this drives a simple strategy for safely investing a 401(k) for maximum profit. Intermediate-term, investing with stock index tracking-ETFs (both their long and short varieties) is advanced. Short-term, stock index options occasionally offer extraordinary profit opportunities when the stock market is moving along its projected path.
Nothing is set in stone. Nor is the stock market's path of least resistance always known. More often than not, there are no stock index option positions recommended.
 There's an easy way to boost your investment discipline...
Get Real-Time Trade Notification!


