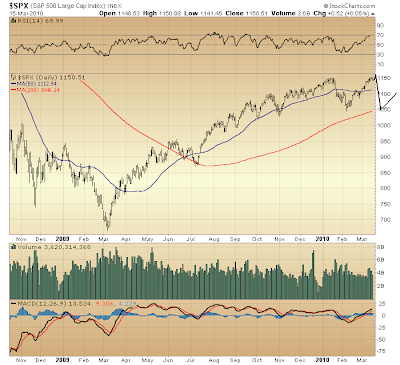
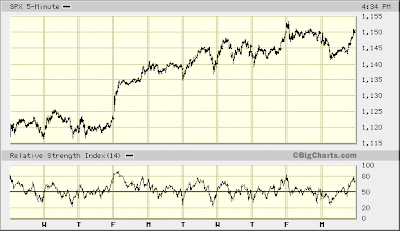
Were an extended period of topping ahead, the range in which indexes move over the next few months might more or less have been established during the first ten weeks of 2010...

The projection above about summarizes the view put forward here over the past week or so. The lift off early-February bottom presently is thought to have bought time ... and that alone. Of five waves forming wave C off March '09 bottom, the fourth wave (beginning early-January 2010) is seen unfolding right now.

The present leg up (off early-February bottom) appears still to have life. A bit more sideways consolidation, then one final lift higher should about do it.
Technically, under the covers, there are divergences everywhere. Some continue confirming a still weakening, counter-trend rally (off March '09 bottom) and others reveal the present leg higher is nearing its end.

* * * * *
© The Risk Averse Alert — Advocating a patient, disciplined approach to stock market investing. Overriding objective is limiting financial risk. Minimizing investment capital loss is a priority.
Analysis centers on the stock market's path of least resistance. Long-term, this drives a simple strategy for safely investing a 401(k) for maximum profit. Intermediate-term, investing with stock index tracking-ETFs (both their long and short varieties) is advanced. Short-term, stock index options occasionally offer extraordinary profit opportunities when the stock market is moving along its projected path.
Nothing is set in stone. Nor is the stock market's path of least resistance always known. More often than not, there are no stock index option positions recommended.
 There's an easy way to boost your investment discipline...
Get Real-Time Trade Notification!


1 comments:
Hmm... Yours is an interesting perspective to be sure. However what I see is a successful rejection of the sell off from 1/10 to 2/5 -- A beautiful "hanging man" as they say in candlestick parlance or a "pin bar" as others call it on 2/5 (at 1050 on the S&P) and then a roaring rally above the 50% retracement of the entire bear-market move and (wait for it) a *breakout* to new highs, leading to the inevitable test of 1200 or even 1225(ish) which is the 61.8% Fibonacci retracement. There's very little that is bearish in today's price action.
Look at the beautiful chart on GE! If that isn't an American bellwether, I don't know what is!
When the Fed starts raising rates, then you'll get your signal, but the market is unequivocally saying: Buy. Well, I take that back...If you aren't long already, you had a golden opportunity to get long on 2/8 or 2/9 after the beautiful price action i described above... The market is saying: Hold!
As "Old Partridge" says in Reminiscences: "After all, It's a bull market!"
Best Regards old boy and good luck out there!
Post a Comment