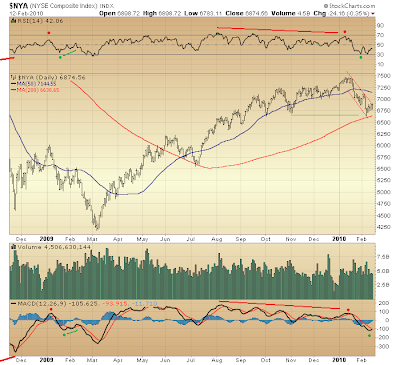
Since simple moving averages (200-day, 50-day) on major stock indexes remain positively configured (50-day above a rising 200-day), one might wonder whether a further lift higher might still develop.
In so doing, however, realize: inasmuch as one might reasonably suppose adequate correction has completed ... with behavior of coincident technical measures — increasingly weakening, yet still more or less holding together — likewise making some case for another turn higher ... evidence suggesting top already is in provides enough compelling reason to fear a terribly steep drop might be nearer than most presently imagine.
First the big picture, courtesy the former "stock market for the next hundred years."

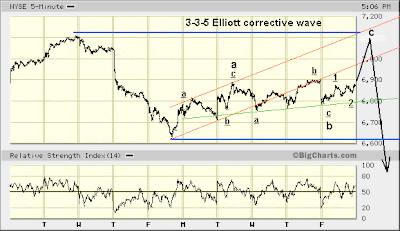
Relative strength applied to the Elliott wave count is a study in complements ... solidifying the prospective five waves up and subsequent correction thus labeled.
Per what's coming ... that "terribly steep drop" mentioned above is seen but challenging March '09 lows. Contrarily, when it looks time for wave (c) to fall into the range of the fourth wave of one lesser degree (i.e. wave 4) expect language like, "breathtaking collapse."

Once again, relative strength applied to the Elliott wave count from March '09 bottom is a study in complements solidifying the prospective five waves up you see labeled above. In the spirit of "like from like" relative strength is equaled during two of the sub-waves [up] of each of the three impulse waves (i.e. waves 1, 3, and 5) of wave c of (b). Then, in the spirit of the "rule of alternation" those sub-waves that reached RSI equality differed in wave 3 versus waves 1 and 5.
And to reiterate a recent theme ... weakening relative strength (RSI) and momentum (MACD) — although holding together by way of remaining above levels registered at March '09 low — can be seen presenting a fine disguise masking trouble ahead. As I have said before, such has been the way of many a derivative technical measure since October 2007 top, just prior to a gassing.

Something of a curious momentum and relative strength similarity, now versus last year's start. One big difference, though, is the fact that, last year, these measures were in the midst of positively diverging in formation of a bottom, whereas this year they are negatively diverging and signaling a top. The "rule of alternation" strikes again it seems. The present moment's risk is substantially increased.
Still, given this week's failure to extend last week's letdown, less likely appears the possibility a third wave of five waves down from mid-January top has begun. (These anticipated five waves down risk rapidly putting in the cross hairs March '09 lows, although not likely are they to exceed them.)
So, a first wave down rather is seen ending last week, and now a second wave up is forming, correcting the decline from top. Given this, what is reasonably made of third-wave -like characteristics demonstrated during last week's slide, then?
Well, the case supposing top is in and a significant decline has begun (a.k.a. "terribly steep drop") — albeit with but the first wave of five larger waves down completed — finds alarming substantiation, because last week's final move in the first wave lower suggests more weakness yet to come. Likewise, this prospect continues finding technical evidence in abundant, compelling agreement.
So, seeing last week completing a first wave down, and this week correcting it, the view straight ahead clears...

Last week's best levels still remain a reasonable objective, as was first mentioned here about this time last week.
Now, we are going into a four-day week, and I recall the last four-day week a couple weeks back likewise had a promising start and then ended badly. So, in the spirit of alternation the coming four-day week might not end badly, then. Eventually, though, last Friday's low (ending the first wave down) will be broken, if in fact top is in.

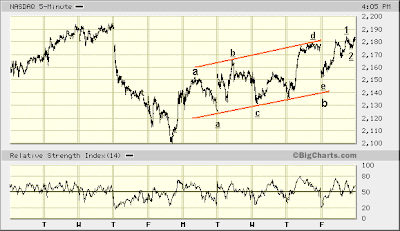
NASDAQ, the bigger bouncer upper, leading the way higher here after technically lagging for months on end, is complacency's red flag.
Money behind such bullish views as those held by the usual Fast Money suspects is thought a determining factor. The logic is like thin ice, though. It does not hold much weight. Listen for yourself...

* * * * *
© The Risk Averse Alert — Advocating a patient, disciplined approach to stock market investing. Overriding objective is limiting financial risk. Minimizing investment capital loss is a priority.
Analysis centers on the stock market's path of least resistance. Long-term, this drives a simple strategy for safely investing a 401(k) for maximum profit. Intermediate-term, investing with stock index tracking-ETFs (both their long and short varieties) is advanced. Short-term, stock index options occasionally offer extraordinary profit opportunities when the stock market is moving along its projected path.
Nothing is set in stone. Nor is the stock market's path of least resistance always known. More often than not, there are no stock index option positions recommended.
 There's an easy way to boost your investment discipline...
Get Real-Time Trade Notification!


