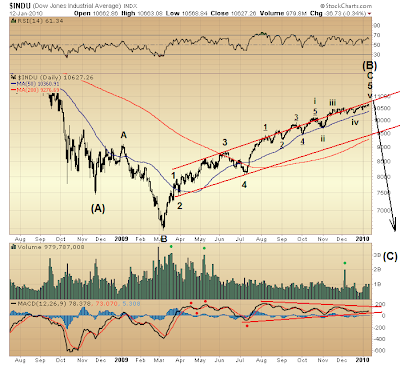
An Elliott delight tonight. Everything is just right again. All the more, everything still is the same. This in a very good way — confirming the same bear spotted months ago still climbs a greased slope ... with increasing weakness only further revealed.
Thus, observations made over the past six months remain as valid as ever. Likewise consistent are the same demonstrations substantiating Elliott wave form: but a counter-trend rally in a bear market that began October 2007 is nearing its completion.

An extended fifth wave is forming. Relative strength (RSI) and momentum (MACD) continue fading. Yet, too, these measures continue on the positive side of their respective ranges, confirming, indeed, a C-wave is forming.
What used to be waves i-v of 5 now are waves 1-5 of i of 5. Duly note how most recent volume spike ("get your [capital starved] bank on") coincided with completion of the third wave (wave iii) of wave 5. A similar third-wave volume spike occurred at the completion of wave iii of 3 and wave iii of 1 (noted via green dots). Interesting.
Hard to say whether wave iv of 5 presently might be forming still (rather than completed, as suggested above). It's possible wave iv RSI and MACD might first degrade below respective readings registered during formation of wave ii of 5 (as is typical), leaving wave v of 5 [of C of (B)] yet to follow. Maybe not, though.

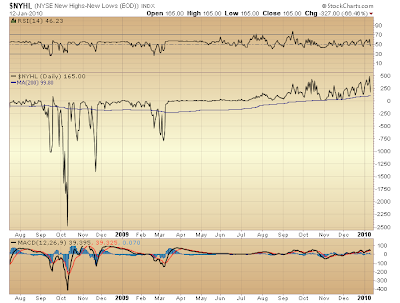
Yesterday's expansion of the NYSE New 52-week High-Low differential to a new high, post-March '09 bottom (not matched on NASDAQ), suggests wave 5 of C of (B) might be some days away from completing. Then again, maybe it is entirely appropriate an NYSE new-high peak coincide with the end of a major counter-trend rally. Might not growing euphoria — widening [ETF-driven] NYSE-listed share love — signal top?
Either way, given what has passed these last 2 to 10+ years, that major indexes are likely to challenge lowest levels reached over the interim, minimally, yet again appears a probability whose moment of truth is drawing near.

* * * * *
© The Risk Averse Alert — Advocating a patient, disciplined approach to stock market investing. Overriding objective is limiting financial risk. Minimizing investment capital loss is a priority.
Analysis centers on the stock market's path of least resistance. Long-term, this drives a simple strategy for safely investing a 401(k) for maximum profit. Intermediate-term, investing with stock index tracking-ETFs (both their long and short varieties) is advanced. Short-term, stock index options occasionally offer extraordinary profit opportunities when the stock market is moving along its projected path.
Nothing is set in stone. Nor is the stock market's path of least resistance always known. More often than not, there are no stock index option positions recommended.
 There's an easy way to boost your investment discipline...
Get Real-Time Trade Notification!


5 comments:
Here we go again... now you're applying trendlines to MACDs and RSIs? Why not take a MACD of the MACD? Or maybe a MACD of the RSI readings - and then smooth that with a moving average and perform some elliot wave on that?
Bottom line - none of what you've written above is either testable or actionable (unless one's preferred investment strategy is throwing darts).
And meanwhile the S&P is up 3% already this year and we break out to new highs. You can draw as many arrows as you want towards 6,000 on the Dow but as we make new highs, the market is telling you that you are wrong...
And never forget:
The trend is your friend.
Yo EBITDA!
I was afraid you might be lost somewhere in earnings fantasy land, now that the big show has begun. Have you been working on some brilliant thesis to enlighten my readers about all the "value" locked up in AMZN ... or JPM for that matter?
Wow, we're up 3% already! What are you going to do with it all?
Hey, you never told me whether you took Jesse Livermore's advice to hold your bullish ground in May 2008. Out of curiosity were you likewise as bullish in 2000 as you are right now?
Seriously, though, you are confused about the manner in which I use relative strength (RSI) and momentum (MACD) as a means of validating an Elliott Wave count. You are, of course, free to ignore this, because some curmudgeon you previously cited has some problem understanding how the Elliott Wave offers any value to an investor. I suppose I would find this vexing were I hoping to convert the world.
EBITDA, I welcome your comments because I believe posterity is served seeing firsthand how a sucker mistakes a counter-trend rally in a bear market from a bull market with staying power (whose likes in all probability is many, many months from ever reappearing).
Oh I have a new nickname - sweet! I will now sign all my love notes "EBITDA".
+3% in two weeks is more than you'll earn in any money market account all year...Hell, it's more than you'll earn on a 5yr treasury bond. Indeed 3% in two weeks...well you don't want to know what that works out to compounded and annualized.
But continue to scoff if that's what makes you feel good. I would be curious to know how we can test whether your wave counts can make us any money.
As for your question about whether I was bullish in 2008 or in 2000 -- well that one is quite easy -- were we making new highs then? In fact, were we making a series of higher-highs? Did we test & then break above the 50% Fibonacci retracement of one of the largest moves of our time... Hmm..didn't think so. Fundamentally speaking...were we just entering, or were we just exiting a recession? I might turn the question around and ask you, did you remain bearish during 2003 and miss one of the best years for small/mid cap investing...Ever?
There are quite easy ways to see which way the trend points. Don't let your "fundamental" reasons for being bearish making you miss the "technical" reasons to be bullish.
Yours Truly,
EBITDA
PS - And as for earnings...Intel's look pretty good today (Revenues & Earnings Beat and guiding analyst higher for next quarter). I wonder how that will affect the INDEXes.
Not sure if we're living on the same planet, but in the year 2000 the NASDAQ Composite topped north of 5000 and subsequently was throttled nearly 80%. Sure, I got out early (January 2000), but I was not crushed when the lug nuts came off.
Ditto 2008 (and my exit was considerably more timely).
Per 2003, I went long mid-February. At the time, NASDAQ -- both on the surface and internally -- was leading the way in building a solid bottom. Likewise, selling exhaustion (demonstrated via volume) and weekly relative strength improvement from July '02 - March '03 across all broad market indexes was indicating a floor was being put in place. (I wrote about this here detailing why the counter-trend rally off March '09 bottom likely was not the end of the bear market that began October 2007.)
For the record, my outlook since May 2008 has not been entirely negative.
Yet you mistake my reasons now for being 100% bearish. These are all technically based. The fundamental fact the Great Leverage Unwind has hardly begun is but icing on the cake.
Per how INTC might affect indexes, who cares! If there's a bump, it won't last. INTC down 70% from Y2k says everything about the so-called new era in technology. Indeed, at a 50x multiple INTC probably has a date with destiny in the low single-digits.
Apparently we are not living on the same planet. Your reading comprehension is as bad as some of your forecasts.
Re: Nasdaq
The High:
3/10/2000 - Intraday high: 5132.52
3/10/2000 - Close: 5048.62
Next subsequent attempt to make a new high (which failed):
3/24/2000 - Intraday High: 5078.86
3/24/2000 - Close: 4963
Do either of those qualify as "higher highs" to you? When a market rejects a nice big round number like 5,000 you should sit up and notice (especially a market that had just plowed right through 3,000 and 4,000...). And after the 4/4/2000 close around 4200 on scary-high volume, i think most technically inclined market watchers would have gotten the idea the trend was 'a changin'. To lose 80% in that market you would have to be a blind buy and hold'er with no concept of what a "stop loss" is.
As for 2008 (switching gears to the DOW) after making an intra-day high of 14,198.1 on 10/11/07, the dow failed to come close to that in the next 3 months, falling back to around 13,000. Whatever technical system you want to use (MA crossovers, Channel Breakout/breakdown, support/resistance, etc), the market started to make a series of lower lows (in laymans terms...a downtrend) and anyone with a system could have seen the writing on the wall. At the most basic level, the market was below it's 200-day MA for all but ONE day the entirety of 2008... So take a victory lap if you want, seems like a true no brainer there.
The TREND changed and so you exit the market and/or go short. There is nothing magical about it.
As for the current market -- The TREND hasn't changed, so why piss into the wind?
And I'm sorry my friend, if you want to compare every stock to the high that it made during the tech bubble, be my guest -- I'm not sure what you're proving besides the over-valuation of that period. As for INTC, nice try, it trades at 15x earnings...oh wait, i'm sorry P/Crap was it?
Happy Friday,
EBITDA
PS: And I guess I'll have to take you at your word for your calls in 2000 & 2003. The links you posted are of blog posts from 2009...
Post a Comment