Friday, February 27, 2009

Pictures of a Bottoming Process


So, a record 1.9 billion shares of Citigroup changed hands today, nearly doubling its previous record for the number of shares exchanged in a single day. This while its price was wacked for a 40% loss. The previous record for Citi shares exchanged was set on ... drum roll ... November 21, 2008.

I point this out because today saw the highest volume of shares exchanged all year on the NYSE. This took me by surprise. I hadn't heard a thing about it all day on CNBC. Maybe I just wasn't paying attention. Looking into the reason I found it was all due to Citigroup.

Of course, today's bump in volume raises the question of whether some similarity to circumstances mid-September '08 suddenly has developed?

So, I ask myself. Did Citi file for bankruptcy (like Lehman Brothers), exposing a huge swath of liabilities throughout the financial system?

Nope.

Is Washington hoping to attract private risk capital or drive it away?

Well, Uncle Sam wouldn't be raising its Citi stake to 40% were it the latter. 1.9 billion shares of Citigroup were, in fact, bought today on the open market. Some apparently think Treasury's support at least means something. I agree.

That its life is being supported substantiates principle seeking stability. Of course, capital injections alone will not do. Nor will bottomless pits be filled. But it seems determination to bring stability is prerequisite to confidence returning. And yet how expensive are even these baby steps!

Short-term and intermediate-term the stock market appears to be bottoming.


$NYA
$COMPQ

As you can see underlying conditions, intermediate-term, are quite like they were back in early '03. Once again, NASDAQ is leading the way in forming a base. Do animal spirits once again sense opportunity?
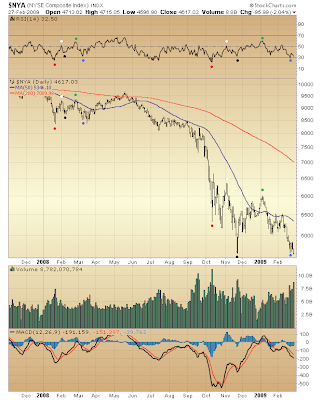

$NYA

RSI above highlights similarity in the NYSE Composite's bottoming process, now versus early '08. We also see similar volume characteristics comparing the two periods.

It is interesting to note how the index, itself, has behaved in the current period relative to the prior. Each step of the way during the current bottoming process the index has performed precisely in opposition to its performance previously. Even today, the NYSE Composite set a new, intra-day low, where as last March it failed to do so.

There probably is a bit more downside left to go before bottom finally is in. But it's near. This much seems clear.


$COMPQ

Again, we see similar RSI performance coinciding with the NASDAQ Composite's bottoming process, now versus early '08. This time, though, NASDAQ is not setting new lows.

Here's something to think about... Whereas NASDAQ's performance last March might have been foretelling worse to come following its subsequent bounce (because in setting new lows, relative to January, waning animal spirits were being demonstrated), this time around it might be foretelling bottom set November '08 might likely hold up for months to come. In other words, following NASDAQ's upcoming bounce (which could carry the index upward of 2000-2200 before all is said and done) any renewed weakness likely will find support in the vicinity where the index presently trades.

A retest of current levels sometime over, say, the next year (following NASDAQ's upcoming bounce) certainly has reasonable probability. Just how this retest develops probably will have bearing on what subsequently follows. If in that retest we see something like last March, then levels seen last in 1994 might hang in the balance (following yet another bounce subsequent to retest). So, there in a nutshell is a prospective outlook for the next couple years or so.


$COMPQ

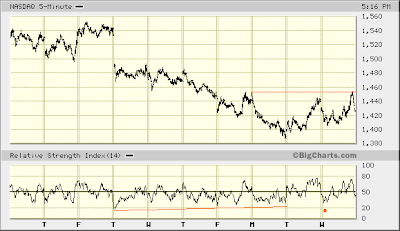
As for the market's present leg down (likely the final), I have a sneaking suspicion this thing might be milked for everything it is worth. Dread. So, continue looking for technical divergences the likes of which I highlighted yesterday.

There are a few distinct possibilities as to how bottom might finally be reached. The markup drawn above presents a rough sketch of the boundaries within which trading over coming days might be confined. Whatever. Bottom is nearly at hand.

I can recall late last year speculating about prospects relating to the market's bottoming process. The thinking was it could take some months to develop. Turns out this has come to pass. Too bad I got sucked in by markedly improved underlying technical conditions going into the New Year. It'll all come out in the wash. My positive expectations await but bottom's confirmation sometime over the days straight ahead.


Fast Money
* * * * *

© The Risk Averse Alert — Advocating a patient, disciplined approach to stock market investing. Overriding objective is limiting financial risk. Minimizing investment capital loss is a priority.

Analysis centers on the stock market's path of least resistance. Long-term, this drives a simple strategy for safely investing a 401(k) for maximum profit. Intermediate-term, investing with stock index tracking-ETFs (both their long and short varieties) is advanced. Short-term, stock index options occasionally offer extraordinary profit opportunities when the stock market is moving along its projected path.

Nothing is set in stone. Nor is the stock market's path of least resistance always known. More often than not, there are no stock index option positions recommended.


There's an easy way to boost your investment discipline...

Get Real-Time Trade Notification!

Thursday, February 26, 2009

Two Rights Do Not Make A Wrong


Back on January 30th someone anonymous asked...
Does the destruction in the NYSE McClellan Oscillator make you reconsider your melt-up thesis?

Starting to look like mid-September, no?

To which I responded...
I don't see trouble signaled by the McClellan Oscillator, particularly with the Summation Index now in positive ground (although declining as a consequence of January's pressure). This was not the configuration of McClellan measures mid-September. Then, both were falling and squarely locked on the sell-side (below 0).

A further difference now v. then is two-fold. First, there has been no breakdown to new lows in major indexes during the present bout of selling (unlike early-Sept '08), and second, volume of shares exchanged during January's sell-off has been contracting (relative to Nov. '08) rather than expanding like it was in September (relative to June-July '08).

Even with the luxury of hindsight my conclusion is unchanged. Like I said Monday...
[T]echnical conditions — having materially deteriorated in a way virtually impossible to forecast two weeks ago — continue possessing qualities showing improvement over time (October '08 to present) and now display notably "oversold" indications.

And I stand by the difficulty forecasting the market's decline of the past few weeks. Yet look what came of the exchange on January 30th...


NYSE McClellan

Following Monday's sell-off I noted how "the worst week since October 10, 2008 continued." Just look at the similarity in the NYSE McClellan Oscillator's behavior (January '09 to present, versus September-October '08)! Incredible.

Did not see it coming. Forgive me for being repetitive. Yet, too, you see how both comments on January 30th were correct, each in a relevant way to thinking behind their respective messages.

Then, following Tuesday's "Coma-Inducing Bernanke Testimony Driving Bears Into Hibernation" trade higher (recovering most of Monday's losses) I suggested...
Prudence ... advises one expect a retest of [Monday's] intra-day lows coinciding with technical divergences confirming bottom is in.

Well, that's the picture of what I wanted to present tonight. You see this "retest ... coinciding with technical divergence" via green dots marking NYSE McClellan Oscillator sell-side lows followed shortly thereafter by a bottom in the NYSE Composite Index (marked by vertical red lines).

See the technical divergence in the McClellan Oscillator's reading at highlighted bottoms in the NYSE Composite Index? We have yet to see this at present. Somehow ... someway ... a divergence like this should register at bottom. Prudence, indeed, advises one expect this.

Nevertheless, bottom is near, as you can plainly see. Soon, at last, the stage might be set for what could be the mother of all short squeezes. On this count I find Shemp's dire outlook rather encouraging...


Fast Money
* * * * *

© The Risk Averse Alert — Advocating a patient, disciplined approach to stock market investing. Overriding objective is limiting financial risk. Minimizing investment capital loss is a priority.

Analysis centers on the stock market's path of least resistance. Long-term, this drives a simple strategy for safely investing a 401(k) for maximum profit. Intermediate-term, investing with stock index tracking-ETFs (both their long and short varieties) is advanced. Short-term, stock index options occasionally offer extraordinary profit opportunities when the stock market is moving along its projected path.

Nothing is set in stone. Nor is the stock market's path of least resistance always known. More often than not, there are no stock index option positions recommended.


There's an easy way to boost your investment discipline...

Get Real-Time Trade Notification!

Wednesday, February 25, 2009

If Bottom Is In, What Next?


It's possible bottom is in. Of course, this does not mean indexes immediately surge higher, not to look back anytime soon. In fact, there could be some further bump up ... recovering a significant portion of the past two weeks' losses ... followed by a pullback to the vicinity of current levels ... all paving the way for a subsequent upside explosion.

Let me temper yesterday's closing remark about "the mother of all short squeezes." This move higher is likely to unfold in stages — a 5-wave Elliott Wave whose components will be apparent on daily charts. I wanted to make this distinction because you might have assumed "the mother of all short squeezes" meant a straight line up.

Now, a straight-line move of this sort still could develop. It would be during formation of the middle wave (i.e. the 3rd wave ... typically the most dynamic Elliott Wave). Needless to say this is some weeks off.


$NYA
$COMPQ

Note how over the past three months NYSE and NASDAQ Composite Indexes have bottomed days following options expiration. This at present is interesting in light of the fact that, some underlying technicals (like Bullish Percent Indexes, 52-week High-Low differentials, VIX) have improved over the same, 3-month duration, while others currently register "oversold" readings.


NYSE 5-min
NASDAQ 5-min

I am impressed by the fact both NYSE and NASDAQ Composite Indexes have recovered Monday's losses, while at the same time RSI is improving. If by chance the week ends positive, this will bode well for bottoming being in.


Fast Money
* * * * *

© The Risk Averse Alert — Advocating a patient, disciplined approach to stock market investing. Overriding objective is limiting financial risk. Minimizing investment capital loss is a priority.

Analysis centers on the stock market's path of least resistance. Long-term, this drives a simple strategy for safely investing a 401(k) for maximum profit. Intermediate-term, investing with stock index tracking-ETFs (both their long and short varieties) is advanced. Short-term, stock index options occasionally offer extraordinary profit opportunities when the stock market is moving along its projected path.

Nothing is set in stone. Nor is the stock market's path of least resistance always known. More often than not, there are no stock index option positions recommended.


There's an easy way to boost your investment discipline...

Get Real-Time Trade Notification!

Tuesday, February 24, 2009

Coma-Inducing Bernanke Testimony Drives Bears Into Hibernation


Let's try not reading too much into today's sudden turn higher. Probably the most promising development to come of it was the lift major indexes made above respective price channels containing declines over the past two weeks (albeit ever so slight was each channel's upside penetration). Nevertheless, it simply is too early to assume this is the start of something big. At worst, today was a positive first-sign the decline of the past two weeks is near its end (if it is not, in fact, already over).

Prudence rather advises one expect a retest of yesterday's intra-day lows coinciding with technical divergences confirming bottom is in. Given how sharp was the reversal in various technical indicators coincident with today's advance — raising suspicion of a buy-side imbalance ripe for the testing by those interests largely responsible for driving prices lower these past two weeks — the smartest stance at this moment is one anticipating further confirmation a big turn higher could, indeed, be imminent.

Already, we are seeing technical divergences, now versus October - November 2008, substantiating a view that sees indexes building a base over the past several months. So, add short-term technical divergences still to come (?), raising the likelihood bottom to the market's present decline is in, and the stage will be set for what could be the mother of all short squeezes.


Fast Money
* * * * *

© The Risk Averse Alert — Advocating a patient, disciplined approach to stock market investing. Overriding objective is limiting financial risk. Minimizing investment capital loss is a priority.

Analysis centers on the stock market's path of least resistance. Long-term, this drives a simple strategy for safely investing a 401(k) for maximum profit. Intermediate-term, investing with stock index tracking-ETFs (both their long and short varieties) is advanced. Short-term, stock index options occasionally offer extraordinary profit opportunities when the stock market is moving along its projected path.

Nothing is set in stone. Nor is the stock market's path of least resistance always known. More often than not, there are no stock index option positions recommended.


There's an easy way to boost your investment discipline...

Get Real-Time Trade Notification!

Monday, February 23, 2009

A Tale of Two C Waves


The worst week since October 10, 2008 continued today. Oddly enough unfolding that week was an Elliott third wave, too (i.e. wave iii of 3 of C). This time a "c" wave of a "B" wave (of an A-B-C corrective wave from the November 21, 2008 bottom). Soon enough wave C [up] should unfold.

The market's course over the past two weeks certainly was not what I thought likely. Call it one of my few way out in left field moments. You may have heard. Everyone but Bernie Madoff experiences these from time to time.

Trouble is I am 0/2 in recognizing the immanency of both significant third waves down — that of October 2008 and again over the past two weeks. First time simply was a bad miss. Still, I was not long the market. And this time around? I really hesitate to call it a bad miss. My only wonder here is what of the unexpected trade over the past two week can be ascribed to circumstances involving concentration of financial power in too few hands?

Well-healed or not, every man puts his pants on much the same way. Well-healed or not, the majority in either camp possesses no more wisdom than a lemming. Having seen both Bear Stearns and Lehman Brothers squashed like bugs, it's small wonder there's little will to take the road less traveled among a diminished crowd of major players.

This dynamic certainly will work with equal force on the flip side of the trade. Inasmuch as the lemming principle — be it by short squeeze or bull run — was considered two weeks ago the dynamic likely to propel the market to new highs, calendar year '09, nothing about this outlook has changed. Indeed, the past two weeks improves odds this dynamic — working through a diminished crowd of major players — is a force making for the kind of powerful move higher characteristic of the Elliott wave I continue anticipating (i.e. wave "C").

All told, I am not the least bit frightened about the prospect of losing a fortune here.

What unfolded over the past couple weeks is but part of some corrective wave that began November 21, 2008. And I still haven't the slightest doubt about prospects for exiting my Ultra ETF positions at a profit.


$INDU

Believing "the market will come back" is no unsubstantiated leap of faith here. Although nothing is set in stone for sure, the fundamental reality behind my present optimism remains undeterred. There's still no death wish sweeping over Wall Street. And Uncle Sam is not about to shut down the sugar factory. So, the stock market is not on the verge of collapsing. Major indexes are not likely to be throttled back to levels last seen in 1994, at least not anytime soon.

Likewise, technical conditions — having materially deteriorated in a way virtually impossible to forecast two weeks ago — continue possessing qualities showing improvement over time (October '08 to present) and now display notably "oversold" indications.

I'll work on the charts. Tonight, I simply wish to write and think aloud.

I think the upcoming launch higher could take major indexes back up to their respective 200-day moving averages so fast most heads will spin.

I also think it was a wise decision last October to change "will" to "could" when stating the possibility that, the Dow Industrials could fall to 3600 sometime during the next few years (it's over to the left under "Things I Believe"). Long-term support highlighted Friday is considered formidable in the realm of an Elliott Wave possibility that would have the stock market's ongoing bottoming process lasting another couple years or more (yes, years).

In other words, over the next couple years, the stock market might trade in a narrowing, sideways range taking major indexes only slightly lower than where they presently are.

I think this is a distinct possibility. Should a monster move higher imminently unfold, this likelihood should only grow. All things considered, a reasonable outlook over the next few years visualizes a situation like WWI, featuring lots of bloodshed and little on the ground progress in either direction...

It was the best of times, it was the worst of times, it was the age of wisdom, it was the age of foolishness, it was the epoch of belief, it was the epoch of incredulity, it was the season of Light, it was the season of Darkness, it was the spring of hope, it was the winter of despair, we had everything before us, we had nothing before us, we were all going direct to heaven, we were all going direct the other way - in short, the period was so far like the present period, that some of its noisiest authorities insisted on its being received, for good or for evil, in the superlative degree of comparison only.
Charles Dickens, A Tale of Two Cities


Fast Money
* * * * *

© The Risk Averse Alert — Advocating a patient, disciplined approach to stock market investing. Overriding objective is limiting financial risk. Minimizing investment capital loss is a priority.

Analysis centers on the stock market's path of least resistance. Long-term, this drives a simple strategy for safely investing a 401(k) for maximum profit. Intermediate-term, investing with stock index tracking-ETFs (both their long and short varieties) is advanced. Short-term, stock index options occasionally offer extraordinary profit opportunities when the stock market is moving along its projected path.

Nothing is set in stone. Nor is the stock market's path of least resistance always known. More often than not, there are no stock index option positions recommended.


There's an easy way to boost your investment discipline...

Get Real-Time Trade Notification!

Friday, February 20, 2009

Inflation of Biblical Proportion


We sure do live in interesting times. Regular readers know I believe our contemporary financial era goes by the mantra called "Inflate or Die."

So, here is something to think about.

Did you know that, if you could have lived and made $1,000,000 a day since the time Jesus walked the earth, you still would not have a trillion dollars? Two thousand years ... a million dollars a day ... and you are still well-shy of $1 trillion. Unbelievable!

Well, these days Uncle Sam is passing out trillions like it were candy. In the game of Inflate or Die the U.S. Treasury has been converted into one giant sugar factory. Let's not overlook this fact. It lends perspective to moments like this past week when the dynamic of the arrangement apparently was prime for testing writers of long hedges (i.e. near-the-money Put options), allowing players choking on inventory an opportunity to offload shares to those writers who would protect their exposure in a falling market.

This, I believe, explains this past week's trading more than all the hysteria on CNBC.


OEX weekly

So, here we are ... right at the same point where things stood in 1997 when Asian financial systems were pillaged to propel an explosion of asset-backed securities tied to increased trade in goods we no longer produce. It's the same point where began the decimation of the regulated financial system supporting the mortgage market (i.e. FNM, FRE) engineered post-9/11 to facilitate the next round of inflationary juice fueling Wall Street's unregulated MBS money machine. And now here we are at the very same point again ... with parasites of physical economies across the globe now moving in with a vengeance on the U.S. Treasury.

Last call for an overflowing shot of AAA-rated alcohol necessary to support an orgy of securities leveraging to the teeth economies whose fundamental means of sustaining vital physical functions have been neglected for decades. Anyone supposing that, trillions of dollars Uncle Sam is pouring down the rat hole will prove insufficient for the stock market to find meaningful support likely is not thinking straight.


$OEX

The noteworthy bump in the volume of shares exchanged at this critical moment in the life of a precariously leveraged, securities-based global financial system suggests buying support, indeed, is entering the stock market. Uncle Sam's opening the Treasury for the sake of supporting quadrillions of dollars in derivative securities apparently finds believers willing to bet stocks will catch a bid.

This does not get a lot of air play, but there is strong fundamental basis for maintaining a positive near-term outlook toward the stock market. It lies with institutional commitment to contain a monster. The choice has been made to inflate at all costs.

Technically speaking, that indexes again trade in the vicinity where bottom twice has been set over the course of the past twelve years does not escape notice among the investment community. You can be sure of this: plenty of seasoned professionals understand the technical dynamic making bottoming a process. Thus, should underlying conditions continue improving as this process further develops, then one of these days buying interest could turn quite serious. Pros who are pacing the market's ongoing bottoming process won't miss a beat once things begin turning up.

What this might bring in the grand scheme is difficult to say with any certainty. I mention this because it is not outside the realm of possibility the present area in which indexes trade could act as a floor for another 5-10 years or more.

But for the here and now my outlook is quite the same as it has been. Despite the last couple weeks not at all unfolding as I had anticipated, the market should soon find legs and turn higher in a fairly big way, taking indexes to the upper end of trading ranges established over the past 4-5 months. More on this next week.


Fast Money
* * * * *

© The Risk Averse Alert — Advocating a patient, disciplined approach to stock market investing. Overriding objective is limiting financial risk. Minimizing investment capital loss is a priority.

Analysis centers on the stock market's path of least resistance. Long-term, this drives a simple strategy for safely investing a 401(k) for maximum profit. Intermediate-term, investing with stock index tracking-ETFs (both their long and short varieties) is advanced. Short-term, stock index options occasionally offer extraordinary profit opportunities when the stock market is moving along its projected path.

Nothing is set in stone. Nor is the stock market's path of least resistance always known. More often than not, there are no stock index option positions recommended.


There's an easy way to boost your investment discipline...

Get Real-Time Trade Notification!

Thursday, February 19, 2009

1,160 Minutes


Question...

If you had an inventory of shares you wished to trim and you were aware a relatively strong vested interest had written insurance against falling stock prices (i.e. Put option contracts), would you not be motivated to feed this interest some of your shares and likewise sell Put contracts to small speculators, taking advantage of fear your share sales precipitated, knowing full well the shares you sell likely will be absorbed?

This reasonable question essentially extends through expiration week considerations put forward in the paradox of VIX levitation. Check this out:


NYSE 5-min

The bulk of this week's decline occurred in the first ten minutes of trading out of the gate on Tuesday (2.17.09). TEN MINUTES! Then, for 1,160 minutes since ... the market has gone absolutely nowhere ... today visiting both the top and bottom ends of the narrow range that developed over the duration.

Believe it or not, something of consequence developed during these 1,160 minutes, despite the market stalling...


$CPC

Put options! Get your put options! Red hot put options! Get 'em while they're hot!

Look at that RSI. Find me one instance over the past, incredibly wild six months when sentiment's relative swing to the negative was so decidedly strong. Why, there is none! Well, what about that? Apparently the frightfully mesmerized haters of government see trouble ahead.

Saps.


$INDU

Now, today's intra-day stumble to a new, multi-year low in the Dow Jones Industrials Average ... taking the index below its intra-day low registered on November 21, 2008 ... does raise a red flag. It prospectively alters how to rightly look (from an Elliott Wave perspective) at the market's decline since May 19, 2008. Five waves down ... at least in the Dow ... might not yet be complete.

Still, per what likely lies ahead, immediately, refer back to comments accompanying the chart of the NASDAQ Composite presented last Friday. Even despite this week's gap below COMP's presumed contracting triangle, I do not for one minute believe everything is about to fall apart. That's because an Elliott Wave "contracting triangle" did not form at all.

I continue viewing index performance at present as bearing similarity to Q1 2003. At that time, too, NASDAQ was leading the bottoming process. Like now, it held up relative better than large cap indexes like NYA and INDU.

Straight ahead, look again at the prospective mark-up drawn on the NYSE Composite chart published Tuesday. A trip back up to '09 highs ... and quite possibly beyond ... still is very much in the cards.

The question raised by today's trade is what might follow this anticipated move to new '09 highs? Today's new intra-day low in the Dow Industrials suggests other indexes might join the Dow, setting new multi-year lows sometime in the near future. Again, the thinking here touches on the possibility the market's decline since May 19, 2008 is not complete.

Be that as it may, though, I continue finding no reason to fear an imminent challenge of November '08 lows across the broader swath of market indexes. Technical divergences persist on broad market index charts, while other underlying measures either are at extreme positions which during the recent past have signaled imminent turns higher (like the CBOE Put/Call ratio above), or remain at critical inflection points.

Taking this still-positive technical configuration in the context of the past 1,160 minutes, the market's near-term outlook still looks promising. Ultra ETF positions I continue holding should recover just fine and turn positive in no time...


Fast Money
* * * * *

© The Risk Averse Alert — Advocating a patient, disciplined approach to stock market investing. Overriding objective is limiting financial risk. Minimizing investment capital loss is a priority.

Analysis centers on the stock market's path of least resistance. Long-term, this drives a simple strategy for safely investing a 401(k) for maximum profit. Intermediate-term, investing with stock index tracking-ETFs (both their long and short varieties) is advanced. Short-term, stock index options occasionally offer extraordinary profit opportunities when the stock market is moving along its projected path.

Nothing is set in stone. Nor is the stock market's path of least resistance always known. More often than not, there are no stock index option positions recommended.


There's an easy way to boost your investment discipline...

Get Real-Time Trade Notification!

Wednesday, February 18, 2009

When High-End Leverage Breaths a Sigh Over Relief


They say a picture is worth a thousand words.


$NYA

So, I'll shut up, because now there's video saying much the same...


Fast Money
* * * * *

© The Risk Averse Alert — Advocating a patient, disciplined approach to stock market investing. Overriding objective is limiting financial risk. Minimizing investment capital loss is a priority.

Analysis centers on the stock market's path of least resistance. Long-term, this drives a simple strategy for safely investing a 401(k) for maximum profit. Intermediate-term, investing with stock index tracking-ETFs (both their long and short varieties) is advanced. Short-term, stock index options occasionally offer extraordinary profit opportunities when the stock market is moving along its projected path.

Nothing is set in stone. Nor is the stock market's path of least resistance always known. More often than not, there are no stock index option positions recommended.


There's an easy way to boost your investment discipline...

Get Real-Time Trade Notification!
Tuesday, February 17, 2009

Wall Street Quakes, Washington Not Shaking


Sorry. But if announcement of that sticky, "Public-Private Partnership" part of Geithner's financial rescue plan is still "weeks away," well, what can I say? Call me naive. I still believe Wall Street is not consumed with a death wish (at least not explicitly) and they'll not push the issue of bailout so soon after Misters Bad Deeds went to Washington.

Of course, most of these burning firms are finished. They're hanging on by 4 trillion threads, a hijacked Treasury, a captive Fed, and a media psy-op to make Joseph Goebbels green with envy. Nevertheless, there's still room yet to maneuver. So, take your CNBC with ample salt to kill the bad taste their panic-stricken pâté is meant to leave, okay?

Today brought the NYSE its second lowest close of the past year (and of the past five-and-a-half years for that matter), yet the "carnage" was nil ... except for my Ultra ETF position ... which loss, of course, is meant to shake me ... but, in fact, fails to accomplish this objective.

Although several things I was not anticipating came to pass today, still, I am not writhing in fear. The Elliott Wave form unfolding from November's bottom is only slightly changed, if it is changed at all. That's it. No big deal.

Did anyone hear about a pending Senate Banking Committee investigation into Wall Street? Me neither. So, the absence of buying must be more part an act of attempted extortion than a widening crisis of confidence rooted in real fear.

Let me be clear. Volume today, relatively speaking, was meager. Another Madoff-sized scam in the books ... the auto industry a day closer to bust ... a few sovereign nations of Eastern Europe threatening default (portending a cascading wave of further defaults) ... Senators talking bank nationalization on network TV ... you'd think if there was real concern, there would have been an avalanche of selling. But notta.

Nope. I am not biting. Sorry, bear.


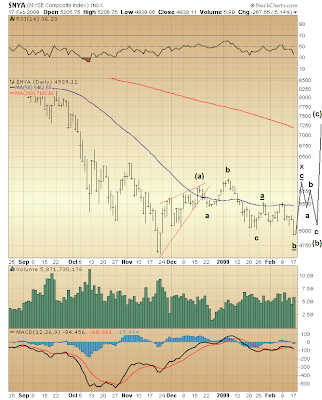
$NYA

Tell me, where don't you see technical divergence? They're everywhere! RSI, MACD, volume. Check, check and check. Scared?

Not sure about the wave count. It's possible wave (b) is minutes from completing (if not complete already), which means wave (c) [up, up and away] is nearer than most fish in the "panic now!" camp dare imagine.


$NYHL

So, hitting new 52-week lows are a bunch of banks and financials, the company Jack Welch wrecked and several other corporations sacrificed on the alter of globalization. But the rest? Holding up. I guess common sense suspects Uncle Sam will come to the financial rescue, one way or another, resuscitating prospects for those not so completely exposed to the structured finance casino. Yes, indeed, I think it's a certainty. However, those financial firms hitting new lows ... the builders of a House of Cards who, come hook or crook (most likely the latter) scheme to have it their way ... well maybe, just maybe, they might still have it their way ... at Burger King. Bon Appetite. Say hello to the Queen.

But seriously, the NYSE New High - New Low Differential was something not long ago I said we should keep an eye on. And look, it's not even September 8th. Which means Lehman Brothers is still alive ... er uh, I mean Wall Street is not as near dead as the CNBC Circus would have us believe.


NYSE 5-min

Well, there's another thing that went against me (in addition to January's low decidedly being taken out). I thought last Thursday's RSI spike meant bottom likely was in. Whether unfolding from last Monday's peak (2.9.09) are five waves down or three (i.e. a-b-c) is in the grand scheme of things inconsequential.

(I'm siding with the former. Volume over the duration supports the five-wave view, having peaked during wave 3 [down] last Tuesday, while diminishing today as wave 5 unfolded.)

RSI's oscillation from buy-side to sell-side during the past week's decline — registering an extreme sell-side reading today — is fitting character of a C wave (as labeled on the NYA daily chart above, wave c of b of x).


$NYAD

Yet judging by this measure you can see why I suspect wave (b) might be ending, bringing to the plate wave (c): the anticipated next leg higher off November '08 bottom — a.k.a. the market's melt-up.

Sideways trading over the past couple months generally has been confirmed by the NYSE Advance-Decline Differential every step of the way. Come what may, there certainly was nothing terribly foreboding signaled as a result of today's one-way trade.

And let's not forget those Put option hedges protecting long positions. This was discussed in last Monday's (2.9.09), On the Paradox of VIX Levitation. The point is a vested interest has financial reasons for seeing the market does not fall apart...


Fast Money
* * * * *

© The Risk Averse Alert — Advocating a patient, disciplined approach to stock market investing. Overriding objective is limiting financial risk. Minimizing investment capital loss is a priority.

Analysis centers on the stock market's path of least resistance. Long-term, this drives a simple strategy for safely investing a 401(k) for maximum profit. Intermediate-term, investing with stock index tracking-ETFs (both their long and short varieties) is advanced. Short-term, stock index options occasionally offer extraordinary profit opportunities when the stock market is moving along its projected path.

Nothing is set in stone. Nor is the stock market's path of least resistance always known. More often than not, there are no stock index option positions recommended.


There's an easy way to boost your investment discipline...

Get Real-Time Trade Notification!

Friday, February 13, 2009

Why Stimulus Package = Stock Market Safety Net


Repeat after me...

In no way is provoking financial panic in the interest of any large holder of risk assets. The ease with which an $800 billion stimulus bill flew through Congress — a sum far beyond anything ever before appropriated — proves it.

Vote this leading stock market expert at FeedTheBullAh, political consensus is a dangerous thing when, on one hand, you've got $4 trillion sitting on the sidelines in money market funds, while your other hand is reaching for a bailout.

THAT was Geithner's message on Tuesday.

Why do you think the Tory Press is so busy berating the guy?

He told the Goldman Sachs Roundtable (and others) straight up: You want to be saved? Save yourselves!

Like I have said before, a game of financial chicken is playing out. And unless Wall Street suddenly has developed a death wish, there is no way they are going to provoke the rage of the nation and the world driving financial markets lower. Not when they have $4 trillion sitting on the sidelines available to plug balance sheet holes.

Drag before Congress a few CEOs whose firms bear direct responsibility for this mess and what do you get? A "voluntary" mortgage foreclosure moratorium from Citigroup, JP Morgan Chase, B of A and Wells Fargo (all of whom paid the House Financial Services Committee a visit the other day). Their appearance was no slap on the wrist. Rather, it was a fair warning.

So, there's a rough sketch of my sense of fundamental reality. And technically speaking, all is well, Mademoiselle...


$NYA

What is not to like? Volume in particular paints the right picture. It's just like July 2002 - March 2003. Ditto RSI and MACD divergences ... but this time it's so much clearer.

That said, though, it's not 2003. Today, the black hand is exposed. Just how it might survive depends a lot on politics. Bottom line, per the market's pending, counter-trend rally, you can forget about so-called financials leading like earlier this decade. In fact, it looks like the group will be an albatros for a long time to come.

This is why upcoming rallies are likely to be the screaming, bear-market kind ... sharp moves in an orgy of short squeezes ... outright war. This is time when everyone jockeys for position. The die largely has been cast. What in the end comes of it remains untold.

Near-term, the general direction appears higher ... but intermediate-term, Dow 3600 still looks good.


$COMPQ

There are Elliott Wave analysts arguing certain indexes are forming a "contracting triangle" — a form occurring just prior to the final move in the direction of the larger trend. If this is true, then we can expect November's low to be taken out very soon.

However, I beg to differ.

First, let's forget about the questionable 3-3-3-3-3 subdivisions of component waves you see within the contracting triangle drawn above (particularly during January's decline). And let's pretend meager volume registered during the formation of wave c of C (late-December '08 thru early-January '09) is not odd character for a "third wave of a third wave" (which typically is the most dynamic Elliott wave).

Rather, let's consider the behavior of RSI and MACD. If the mid-August '08 peak marks the end of wave 2 (of five waves down from October '07), then if the presently forming "contracting triangle" is wave 4, why have both RSI and MACD failed to display typical behavior?

In other words, if the market were one move away from bottom (i.e. wave 5), underlying indications revealing building strength should be presented by relatively improving RSI and MACD behavior, wave 4 versus wave 2. Yet quite the contrary is seen.

Could this be foretelling a monstrously hard move lower, much like everyone and your mama seems to think? With fundamental reality mentioned at the start being what it is?

Sorry, I'm not biting. Rather than five waves down from October '07, I see three — A-B-C — ending November '08. Presently forming are three waves up: a counter-trend rally. This is occurring within a larger Elliott corrective wave whose ultimate objective could result in major stock indexes being smashed back to levels last seen in 1994 sometime over the next few years.


$BPNYA
$BPCOMPQ

Under the covers, not only does the market's relative condition appear considerably improved, several measures likewise lie at critical inflection points.

Taking in the past two years ... given the more positively poised state of this indicator — both applied to NASDAQ and the NYSE — you see why I am bullish here.

One other observation for those who think the market is about to crater...

If this were true, you'd think far fewer issues on both exchanges would be flashing Point-and-Figure buy signals (which is what the Bullish Percent Index measures). Rather, what you see is underlying strength defying the market's apparent weakness. My bet is the apparent divergence resolves with a rising market.


$CPC

And the Magic Eight Ball still agrees...


Fast Money
* * * * *

© The Risk Averse Alert — Advocating a patient, disciplined approach to stock market investing. Overriding objective is limiting financial risk. Minimizing investment capital loss is a priority.

Analysis centers on the stock market's path of least resistance. Long-term, this drives a simple strategy for safely investing a 401(k) for maximum profit. Intermediate-term, investing with stock index tracking-ETFs (both their long and short varieties) is advanced. Short-term, stock index options occasionally offer extraordinary profit opportunities when the stock market is moving along its projected path.

Nothing is set in stone. Nor is the stock market's path of least resistance always known. More often than not, there are no stock index option positions recommended.


There's an easy way to boost your investment discipline...

Get Real-Time Trade Notification!

Thursday, February 12, 2009

Better a Mild Nuisance Than a Marinated CEO


Admit it. Today, when the market was getting pounded, you were thinking, "Some 'mild nuisance, Tom!'" Well, if it happens again, just remember the outcome.

Why do you think I mention this? Because happen again it could. And I say this despite believing the move to new highs, post-November '08 bottom, likely has begun.

In other words, I am not discounting the possibility some significant portion of gains made from today's low could be given back over the next couple days. As much as I would rather not have to endure the pressure of confirming my continued bullish outlook, I might just have to. Better this, though, than being a Wall Street CEO getting grilled before the Congress!


NYSE 5-min

Two things I conclude from today's strong RSI move to the buy-side (above 50). First, it reveals the market's advance during the last hour of trading likely is not related to its decline from Monday's peak (2.9.09). Thus, that [5-wave] decline is over. Likewise, the absolute level to which RSI rose suggests today's reversal was not merely a pause in a larger decline to come. Rather, it says the market's anticipated move higher likely has begun.

Now, typically, strong, one-sided RSI movement indicates a measure of imbalance that's often exploited by the other side of the trade. We saw this following today's sharp decline at the open (after having seen the same thing many times over the past month). And we just might see it again (in reverse) over the next day or two, as well.

But then again...

Third waves typically are the most dynamic Elliott waves. So, supposing an a-b-c wave up from January 23rd is unfolding ... and waves a and b have completed ... then if today began wave c (a third wave in a corrective Elliott Wave form) ... the strong RSI surge is rather fitting the typical character of the wave higher I am expecting.


Fast Money
* * * * *

© The Risk Averse Alert — Advocating a patient, disciplined approach to stock market investing. Overriding objective is limiting financial risk. Minimizing investment capital loss is a priority.

Analysis centers on the stock market's path of least resistance. Long-term, this drives a simple strategy for safely investing a 401(k) for maximum profit. Intermediate-term, investing with stock index tracking-ETFs (both their long and short varieties) is advanced. Short-term, stock index options occasionally offer extraordinary profit opportunities when the stock market is moving along its projected path.

Nothing is set in stone. Nor is the stock market's path of least resistance always known. More often than not, there are no stock index option positions recommended.


There's an easy way to boost your investment discipline...

Get Real-Time Trade Notification!