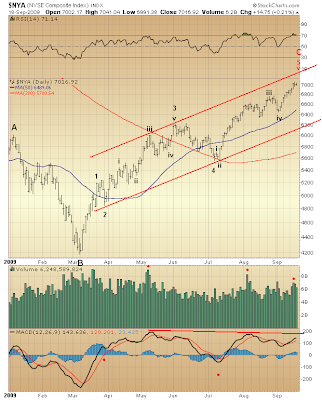
This week's continuation of last week's push to new highs, post-March bottom, just might diminish the likelihood of last week's NYSE Composite Index Elliott wave count. Thus, resumption of the bearish trend that began October 2007 now appears more imminent.
We are right back to the original view ... where wave 5 of C, unfolding since early-July, is seen nearing completion. Then, once done, kaboom. Major indexes easily could challenge respective March '09 lows before year's end, too.

Again, both RSI and MACD degradation, wave 4 versus wave 2 [of C], are typical of a 5-wave Elliott Wave formation. Likewise, nothing about the underlying technical configuration coincident with wave 5 of C's unfolding challenges this particular Elliott wave count. Indeed, across the board the technicals confirm this view without one shred of doubt.
Judging by volume registered this week, the third wave of wave v of 5 of C is in, with only the fourth and fifth waves of wave v of 5 of C still to come. There is not much upside remaining. Time to shed dead equity at prices that might not be seen again for years to come is running short, indeed.

* * * * *
© The Risk Averse Alert — Advocating a patient, disciplined approach to stock market investing. Overriding objective is limiting financial risk. Minimizing investment capital loss is a priority.
Analysis centers on the stock market's path of least resistance. Long-term, this drives a simple strategy for safely investing a 401(k) for maximum profit. Intermediate-term, investing with stock index tracking-ETFs (both their long and short varieties) is advanced. Short-term, stock index options occasionally offer extraordinary profit opportunities when the stock market is moving along its projected path.
Nothing is set in stone. Nor is the stock market's path of least resistance always known. More often than not, there are no stock index option positions recommended.
 There's an easy way to boost your investment discipline...
Get Real-Time Trade Notification!


3 comments:
Hi,
Just wondering what reason you have to prefer your 5-wave count over a zigzag, for example Tony Caldaro's count with Major A at SPX 956, Major B at SPX 869, Int. A of Major C at SPX 1018, and Int. B of Major C at SPX 979. By that count, we are close to ending Minor 3 of Int. C of Major C, implying further upside than your count would suggest.
Let me be clear, I'm not saying he is right and you are wrong (or vice versa). I'm asking if you see a reason to prefer one count over the other.
Thanks!
My reason for labeling the advance off March '09 bottom a 5-wave form is two-fold...
First, the January - March '09 decline seems best labeled a 3-wave move which, itself, followed a 3-wave advance November '08 - January '09. Thus, assuming price action since November '08 bottom is related, then three waves up (11/08 - 1/09) followed by three waves down (1/09 - 3/09) naturally could be followed by five waves up, and thereby form an "irregular flat."
(Now, just how this irregular flat might fit the wave count since October '07 remains to be seen.)
Second, both RSI and MACD support the view supposing five waves up from March '09 bottom are forming, this by how each measure deteriorated during wave 4 of C's formation relative to wave 2 of C. This very technical deterioration (wave 4 versus wave 2) during a 5-wave advance is quite typical.
Likewise, every other technical measure I keep an eye on similarly confirms this view.
Furthermore, no underlying technical measure (save for RSI) has reached levels more positive than was reached during the formation of wave 3 of C. This, too, confirms the view that, five waves up from March '09 have been unfolding, and suggests the advance is nearing completion.
Complementing this is volume's performance. It peaked out during the formation of wave iii of 3 of C and has been fading with every lesser third wave's peak ever since.
Right or wrong, there isn't a strong technical case to be made for an A-B-C off March '09 bottom. This is particularly so considering the performance of various technical measures off early-July '09 bottom. One is hard-pressed to make the case for such "dynamism" typically associated with third waves (which a C wave is) in evaluating the advance off July '09 bottom. I much prefer labeling this a 5th wave rather than a C wave. That this 5th wave, itself, is proving rather dynamic, price-wise, but less so, technically, supports my case claiming a 5-wave advance off March '09 bottom forming a C wave is the more likely Elliott wave count.
Thanks for the detailed answer! I think it would make a good blog post in its own right...
Post a Comment