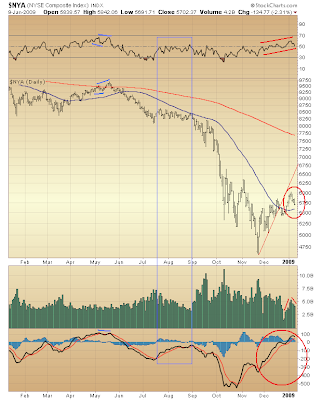
 Let's begin with a brief review of this past week's forecasting whipsaw. As varied as one day's view might have seemed from the last, each was founded on one simple fact: the market's advance since November's bottom has shown no sign of having completed.
Even last Friday when a mini-meltdown appeared possible (portending a fall on the order of 10%), the case for the market subsequently advancing to still higher ground remained conclusive.
Then on Monday came reason to cancel Friday's fear of a mini-meltdown. Tuesday produced suspicion the market's anticipated melt-up was, indeed, at hand. Wednesday delivered the more moderate selling I had projected on Monday. Thursday appeared to complete the bulk of selling pressure. And today was a bit like Lee Corso saying, "Not so fast, my friend!" ... at least on the surface.
Through it all there remains good reason for maintaining confidence the market will continue higher. Furthermore, there likely will be no serious challenge to November's bottom prior to the next leg up.
Might we still see a market melt-up? I am more or less cautiously optimistic.

The above chart of the NYSE Composite brings together the past week's analysis. I'll not elaborate further here. Rather, Sunday evening I will e-mail those receiving Trade Notification, and detail the price-RSI picture.
Technically speaking, dire economic and financial news apparently is rattling nerves to a degree that's disproportionate with the relatively modest selling we have seen over the past few days. This heightened measure of fear (absent glaring technical divergences typical at tops) not only suggests bottom to this week's pullback is near, but also sets up nicely for the melt-up I have been anticipating.
(For an anecdotal glimpse at how elevated fear has become as a result of this week's rather modest decline, check out comments to yesterday's post.)

Pop Quiz: why is the current period better compared to the market's rally going into the May 19, 2008 peak rather than to the July-August '08 consolidation?
The answer is right there. In fact, considering those past instances when I have distinguished "buy-side" and "sell-side" readings for both RSI (top panel) and MACD (bottom panel), your understanding the significance between the one and the other stands to become elevated, given what you see above.
This difference is particularly noteworthy because there were no price-RSI or price-MACD divergences in the July-August '08 period signaling the market's pending turn lower. Indeed, you might say price buoyancy was being confirmed by these two technical measures. However, both were firmly trapped on the sell-side of their respective scales, and this proved significant.
And now? Kind of looks like early-April '08 doesn't it? Do you see how this might be setting up the market's pending melt-up?
Then there's the matter of how a bearish technical divergence typically is displayed. Just look how RSI and MACD were behaving as the NYSE Composite made its final charge higher before peaking on May 19, 2008. Neither measure confirmed the index's advance to new, post-bottom, high ground despite both being on the "buy-side" of their respective ranges.
Do you see anything like this right now? No!
And how about the bullish volume configuration since late-December's bottom (rising and falling in harmony with the index over the past two weeks)? This, itself, follows a month-long churn distinctly possessing an upward bias ... unfolding subsequent to the high-volume launch off late-November's bottom.
If you are reluctant to accept the bullish case, then let me ask you something...
Has a woman ever accused you of being the typical man who thinks with the wrong head? Well, this might be your opportunity to prove "man think" is not always a bad thing.
(Honestly, though, maintaining a bullish posture here does not require much courage.)

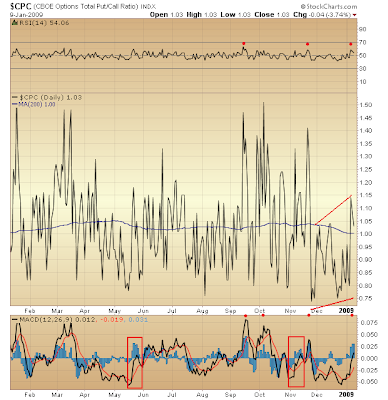
How is it the Put/Call Ratio has presented less bullishly inclined sentiment at each new market peak since November's bottom ... and has been more bearishly inclined at each trough registered at higher lows over the same interim?
This is the face of irrational fear.
Granted, this stands to reason given the past year's disaster. Yet it ignores markedly altered fundamental circumstances being effected by a bunch of Monetarist Monkeys who finally have grown some hair.
Make no mistake about it. Uncle Sam is clamping down on the chaos. This clearly is the message when stories headlined, "Wall Street: It's payback time" make their way into mainstream news outlets.
Did you happen to read...
Attorney general Cuomo and the Manhattan U.S. Attorney's office have publicly announced that they are working jointly on a broad inquiry into allegedly manipulative or fictitious trading in credit default swaps. Based on the documents being sought, prosecutors appear to hypothesize that short-sellers, perhaps with assistance from bank or brokerage officials, faked trades in these instruments to artificially signal to the market widespread panic over a company's condition when, in fact, such sentiments had not existed before the manipulative trading itself.
Talk about your bombshells! Cramer has on several instances made the same claim (though not in such detail). Should this percolate into daily conversation, we just might find Wall Street on the verge of being tamed...
(Just the other day CNBC's Charlie Gasparino called Wall Street "the snake pit of snake pits," so I thought that Ernest bit a fun satire on the way things can pass if discovery fails to separate the fearsome from the fakes. It's probably only a matter of time before we hear from a tyrannical Mother who makes herself out the innocent victim of her "misfit" child...)
"The doctor told me I'd only have to wear these until after the surgery." (LOL!)

* * * * *
© The Risk Averse Alert — Advocating a patient, disciplined approach to stock market investing. Overriding objective is limiting financial risk. Minimizing investment capital loss is a priority.
Analysis centers on the stock market's path of least resistance. Long-term, this drives a simple strategy for safely investing a 401(k) for maximum profit. Intermediate-term, investing with stock index tracking-ETFs (both their long and short varieties) is advanced. Short-term, stock index options occasionally offer extraordinary profit opportunities when the stock market is moving along its projected path.
Nothing is set in stone. Nor is the stock market's path of least resistance always known. More often than not, there are no stock index option positions recommended.
 There's an easy way to boost your investment discipline...
Get Real-Time Trade Notification!


2 comments:
We seem to have breached a technical support level at 880-876 on the S&P. I read some technicians saying it is a long way down from this level. Being long here is not looking very good, to be candid.
I said it before and I will say it again...
Listen to Tommy.
Post a Comment