Monday could mark the beginning of the end for many of the 19 financial institutions targeted by the U.S. Securities and Exchange Commission's emergency rule curbing "abusive short selling." Truth is I suspect all things are not what they seem. There might be more to the SEC's action than meets the eye.
Let's think about this. It's a fact short selling adds liquidity to the marketplace for battered stocks. That's because short positions eventually are covered via a purchase of the shorted stock on the open market. Thus, a stock's relentless drive lower might be halted sooner as short sellers seeking to take profits step in, and buy shares to cover their positions.
Given these facts you would think the SEC emergency rule might instead require every American home owner with a mortgage to escrow a balanced long and short equity position in the GSEs. In other words, if regulators wanted to support share prices of financial institutions grotesquely leveraged to the mortgage market, it seems they would somehow attempt to widen the vested interest in the fortunes of these companies by expanding equity ownership and bolstering the market's capacity to put a floor under their share prices.
Yet, this is not what the SEC emergency rule does. Instead, it weakens the floor under the share prices of those 19 financial institutions affected, making it more difficult for anyone to short their stocks. Brilliant. So, absent any fundamental reorganization restoring confidence in the solvency of these institutions, 'tis only a matter of time before renewed selling pressure stands ready to destroy these companies whose share price safety net has been weakened.
One is left to wonder whether this result is intended. Is this the means by which consolidation in the financial industry is to be hastened?
Still, as they say, timing is everything. Announcing this emergency rule the week options were set to expire was, in the mind of this observer, a fine demonstration of how power is not a function of what you know, but rather who you know. Paper tiger or not, the SEC lit a fire under the financials, affecting a massive short covering rally of historic dimensions, making the SEC commissioner and those Wall Street interests benefiting from this decision worthy of the name Cox.
I crack me up...
Now, this little pilot project — supposedly slated to be in effect only 30 days starting Monday — might already have proven itself so effective its reach could be widened. Imagine the melt-up caused by panicked money managers fearing unwanted scrutiny from the Steal Easy Commission as it extends this rule to cover other heavily shorted sectors. Imagine, too, the assets to be grabbed for pennies on the dollar as the safety net under share prices is removed.
So, put that in your pipe and smoke it as you contemplate my stock market melt-up followed by Dow 3600 thesis.
Returning to the present moment ... the SEC, once swimming aimlessly, now smelling blood, has turned tail and given fright to a bunch of small fry ... while soon-to-be victims bob helplessly, gasping for air ... unaware their demise might be orchestrated to the tune of becoming a shark's cheap meal.
Maestro! Strike up the band.
Is the answer to Final Jeopardy about to be revealed? Make no mistake! The stock market's decline since May 19, 2008 has yet to feature a devastating, panic-stricken dive. The chart of the S&P 100 presented on July 10, 2008 simply was meant to make this case visually.
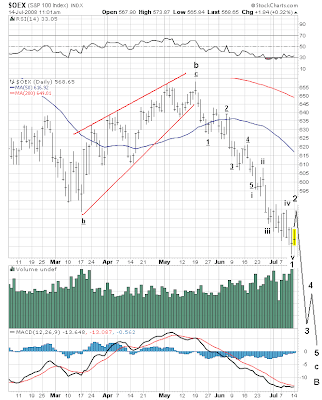
Then, on Monday, July 14, 2008 (see 11:00 a.m. update) I presented the following view showing how the trip to Ground Zero might proceed...

Notice how wave 2 was projected to rise into the area where wave iv of 1 had formed. All rather elementary Elliott Wave stuff.
Hey, did you happen to notice wave iii of 1 is approximately .618 (the Fibonacci ratio) the length of wave i of 1? More geeky Elliott Wave stuff. But powerful! So, get out your calculator and tell me where wave 3 should end. You can assume wave 2 is moments from completing. Likewise, the relationship between waves 1 and 3 probably will be astonishingly similar to the relationship between waves i and iii [of 1].
Did you come up with a target of 520?
"Like from like" is a principle building block of all nature, including human nature. Feel the power...

As I indicated yesterday, "strong recoveries of underlying technicals to levels prevailing some weeks ago when indexes traded considerably higher than they do today ... [is] precisely what one might expect ... just prior to collapse."
And let me tell you ... I wish I had, indeed, anticipated this. Instead, my sights were set on the possibility the market's underlying technical condition would continue to progressively worsen going into the moment of capitulation (i.e. wave 3). Even following Tuesday's (7.15.08) trading ... when I was anticipating a bounce of sorts ... I thought technical weakness would persist.
Bzzzz. Wrong.
And the result? Monsieur Market has cast a pall of uncertainty on imminent prospects by creating cross-currents made to deceive the greater majority of analysts and commentators. I am not one of them, though. I remain convinced the stock market is poised to blow up.
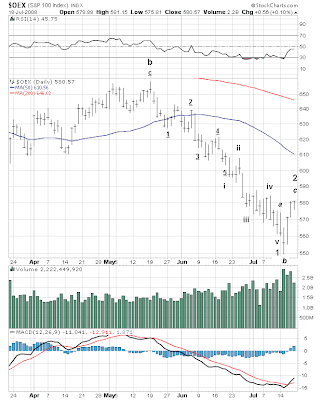
Now, you might look at the above chart, observe the sharp turn higher in daily RSI and think this suggests the S&P 100 has completed its decline from May 19, 2008. But grasshopper, have you noticed RSI remains positioned within the range where sell-side strength is evidenced (i.e. below 50)?
Likewise, observe how RSI flattened out nicely today while the S&P 100 stubbornly held below lows it reached on its worst day of trading yet (June 26 2008), post-5.19.08 top. This is encouraging because it confirms the gravity — the strength — of selling on June 26th and validates the Elliott Wave count I have indicated.
Now, what about the turn higher in MACD? Well, yes, this does bear watching. However, it still remains in negative territory and has a long way to recover before confirming a reversal in the S&P 100's declining trend.
For the moment, then, let's consider what MACD's break higher might be portending by looking at its performance in the mid-April '08 period. At the time MACD (which had been rising) broke lower as the S&P 100 declined to retest its late-March low in the vicinity of 610 (which, by the way, was considerably above the low it set on 3.17.08). Yet, MACD, though falling in sympathy with the S&P 100, held in positive territory. Thus, the market's underlying strength, though momentarily weakened, remained supportive. Subsequently, the S&P 100 launched higher and soon afterward MACD confirmed.
So, the mid-April '08 MACD break lower amounted to nothing more than a head fake. We are probably looking at the same thing right now, but in reverse.
Furthermore, that MACD descended to a fairly deep level of sell-side strength prior to its present turn higher simply lends considerable supporting evidence to the Elliott Wave count I have assigned to the S&P 100's ongoing decline from its May 19, 2008 peak. Everything "fits" expectations implied by my longstanding forecast ... both in how what has unfolded thus far is being technically substantiated ... and in how what is yet to come finds underlying technical conditions perfectly poised to confirm the stock market's pending sharp decline.
I could go through the same exercise with the McClellan Oscillators in particular, both for NYSE and NASDAQ. Much as I alluded yesterday, these too have registered "an incredible reset" ... bouncing to relative levels where one might reasonably expect the stock market to suffer a significant setback, and with all due haste. Just look back to late-December and consider the relative similarity to the present period. You will see precisely what I mean.
Also supporting my present outlook is the continuation of the relatively poorer performance of the NYSE Composite versus the NASDAQ Composite. Quite simply, I consider this circumstance something of a double-edge sword, foretelling the likelihood of further selling pressure, as well as setting up the market for its still pending melt-up.
Being that nothing is set in stone, I should add there is a possibility we could see the market hold up for some weeks before ultimately coming unglued. However, I am rather inclined to suppose the stock market's long awaited capitulation is at hand. There simply is nothing contrived or strained in supposing the moment of truth has arrived.
Of course, there is no way I could pound the table and claim some indisputable reason for supposing the time of departure is NOW. Still, the S&P 100 is positioned precisely where an Elliott Wave Guy can reasonably suppose it will either turn lower, or it won't. This simply presents an options position entry point very well-suited to the cause of low-risk trading.
So, get ready to go long August OEX Puts...
[5:00 p.m.]
The jury remains out on whether the S&P 100's counter-trend rally has completed. However, if its peak has not been reached, then it probably is but moments away. Trading today on NASDAQ supports this view. Indeed, the NASDAQ Composite probably peaked yesterday and has begun its move back down.

Despite a lot of nothing today, RSI continues holding above its low registered Wednesday morning. While neither an issue nor a point of concern, having commented about price-RSI divergence in this morning's update, I wanted to highlight the situation again and suggest the lack of sell-side RSI deterioration, today versus Wednesday, leaves open the possibility the S&P 100 could rise further before turning decidedly lower. Likewise, RSI's lift during today's last hour similarly highlights this possibility.
Now, trading these past two days also supports the likelihood that, vested interests who pulled off Thursday morning's short squeeze probably shot their collective wad. Indeed, if they had any more ammo ... or, more accurately, if they had any further need ... the past nine hours of trading might not have been quite so flat. So, there probably is not much more upside left before the S.O.S. goes out.

Today's gap open lower on the Pump and Dump is likened to warnings produced by minor earthquakes just prior to a volcanic eruption. The course of trading over the remainder of the day all the more confirms the danger. However, going into today's close RSI did manage to creep into the area where buy-side strength is evidenced (i.e. above 50). So, Monday might, indeed, begin on a positive note. That said, I'm willing to bet today's gap open lower will not be filled.
A smallish bump higher Monday morning is what I am anticipating and hoping for. This will present an opportunity to establish a Put position in the August contract and make back the premium we just gave up in the July contract.
Seeing the magnitude and speed of the market's advance Tuesday - Thursday, you should find some comfort knowing our July positions shoulda, woulda, coulda been cause for celebration tonight, rather than resignation. What I mean to say is we saw proof before our very eyes how far a third wave (in this case a "c" wave) can travel. The distance we needed, though in the opposite direction, would easily have been met if wave 3 (of five waves down from the 5.19.08 peak) contrarily had begun to unfold. Conditions were so ripe for it, too! Yet, it simply was not to be. Instead, we saw how in a blink of an eye ... how in an instant ... fortunes can change.
I have much more to say, but right now let me just assure you I remain confident my account's present $1,000 risk capital (double my initial $500 stake) still stands to be multiplied by 100 (maybe more, maybe less) over the course of weeks straight ahead.
There simply is little doubt in my mind the sort of screaming volatility necessary for achieving such a feat remains highly probable.
[11:30 a.m.]
I still do not know if the move up from Tuesday morning's low is but seconds away from completing ... or if a bit more bobbing and weaving might occur in the rarefied air where grotesquely leveraged pigs like JPM hover miles above ground they stood just days ago.

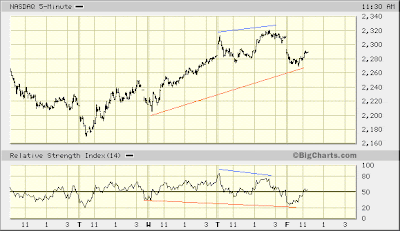
As you see, the S&P 100's advance is losing steam. When my Mr. Market Twitter notes "price-RSI divergence," this is what I am referring to. This condition's manifestation implies growing weakness underlying the trend under consideration (in this case the advance from Tuesday morning's bottom).
Now here's something I prefer leaving in the background. Often times you will see RSI coincident with a fourth wave registering a reading that diverges from RSI registered during the formation of the prior second wave. Thus, assuming today's low during the first half-hour of trading were the end of wave 4, we do not see this typical fourth wave versus second wave RSI divergence. RSI remained above the level it registered during the formation of wave 2.
Does this mean wave 4 has not yet completed? Maybe so, maybe not.
Recall Wednesday's 5:00 p.m. update where I presented a 2-day chart of the S&P 100. At the time I was supposing five waves forming a wave c from Wednesday's low possibly had completed. During the formation of wave c RSI confirmed each sub-wave (i.e. waves 1-5) every step of the way. This, generally speaking, is unusual. However, I also explained why it is not inexplicable.
I bring this up because of the present lack of a fourth wave versus second wave RSI divergence occurring thus far in the advance from Tuesday morning's low. Again, I am anticipating this advance to subdivide into five waves forming wave c. Being that a "c" wave is a third wave — typically possessing the strongest underlying character — we might not expect typical price-RSI divergences. Thus, I am reluctant just yet to label waves 4 and 5 of wave c.

The Composite Index tracking action on the Pump and Dump shows a different picture. We see the same price-RSI divergence developing during the formation of yesterday's top. However, we also see a price-RSI divergence comparing this morning's low versus Wednesday morning's low.
Being today's was a higher low than Wednesday's, RSI registering a lower low indicates a weakening of COMP's advance since Tuesday.
It may turn out the NASDAQ Composite still has one final advance prior to collapsing. The only "clue" I am able to discern here is the exchange favored by boiler rooms all across America is leading the way (as has been typical for many years now), demonstrating a measure of underlying weakness not yet evidenced on the Big Board.
And this is precisely what one should expect prior to Super Regulator "Flounder" entering stage right...
* * * * *
© The Risk Averse Alert — Advocating a patient, disciplined approach to stock market investing. Overriding objective is limiting financial risk. Minimizing investment capital loss is a priority.
Analysis centers on the stock market's path of least resistance. Long-term, this drives a simple strategy for safely investing a 401(k) for maximum profit. Intermediate-term, investing with stock index tracking-ETFs (both their long and short varieties) is advanced. Short-term, stock index options occasionally offer extraordinary profit opportunities when the stock market is moving along its projected path.
Nothing is set in stone. Nor is the stock market's path of least resistance always known. More often than not, there are no stock index option positions recommended.
 There's an easy way to boost your investment discipline...
Get Real-Time Trade Notification!


2 comments:
nice mid day blog post - thanks!
hey, had to follow up my earlier afternoon post and say, now that i got to more slowly read it :-) , that this is great info and charts!
thanks!
Post a Comment